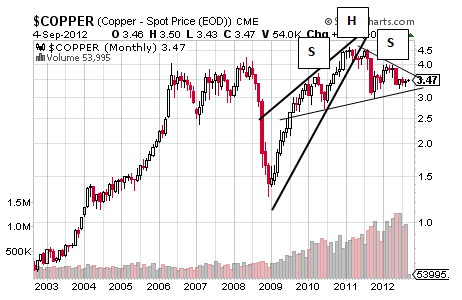
It’s hard to pick what metal to chart first with copper’s outrageously bearish monthly chart nearly matched by the drama showing in silver’s long-term monthly chart with gold setting up what appears likely to be a big disappointment for the many gold bugs out there with a bearish reversal of its QE1 uptrend well-progressed at this point.
Loyalty counts, though, and copper’s monthly through the end of August was viewed here first, so let’s start there with a chart that suggests copper may or may not put in a brief bullish tease up to about $3.75/lb before letting it all fall down in what could make for a December to remember if September disappoints the bears out there.
Timing the unwind of not one but two of the bigger cheap money bubbles in history is, of course, tough to gauge precisely and so let’s say it may happen within a month to six months with any possible delay of what will be a devastating decline made possible by a potential Double Bottom lodged within the last several months of trading and a pattern that confirms at $3.55/lb for a target of approximately $3.75/lb.

Should this small pattern work by taking copper up briefly in the weeks ahead, it will brush copper to the top and lightly marked trendline of the major Symmetrical Triangle to the right that does include trading for early September too and a pattern that is inclined to ignore possible upside confirmation at $4.65/lb for a target of $6.25/lb.
Why is copper likely to use that consolidation to break to the downside rather than the upside? Well putting aside the year and a half trend of lower highs, copper is contending with a well-documented pattern in this work over the last several months and that is none other than the large and rather conspicuous Head and Shoulders pattern born of its own QE1, 2 and OT-LTROed rallies with the combination appearing unlikely to end well despite the best intentions of that pattern’s engineers.
It confirms at about $3.00/lb for a target of about $1.40/lb and quite close to its simplified form and that is none other than the Rising Wedge pattern presenting in risk-on charts everywhere and a pattern that shows the slowing buying momentum of investors who know they are being duped and are willing to tolerate being duped until, very suddenly, they are not as the uncertainty of the sideways Symmetrical Triangle and H&S transforms into outright panic selling.
This – panic selling – is putting it politely, though, considering that copper is still calling for what is more properly called a crash.
Loyalty counts, though, and copper’s monthly through the end of August was viewed here first, so let’s start there with a chart that suggests copper may or may not put in a brief bullish tease up to about $3.75/lb before letting it all fall down in what could make for a December to remember if September disappoints the bears out there.
Timing the unwind of not one but two of the bigger cheap money bubbles in history is, of course, tough to gauge precisely and so let’s say it may happen within a month to six months with any possible delay of what will be a devastating decline made possible by a potential Double Bottom lodged within the last several months of trading and a pattern that confirms at $3.55/lb for a target of approximately $3.75/lb.

Should this small pattern work by taking copper up briefly in the weeks ahead, it will brush copper to the top and lightly marked trendline of the major Symmetrical Triangle to the right that does include trading for early September too and a pattern that is inclined to ignore possible upside confirmation at $4.65/lb for a target of $6.25/lb.
Why is copper likely to use that consolidation to break to the downside rather than the upside? Well putting aside the year and a half trend of lower highs, copper is contending with a well-documented pattern in this work over the last several months and that is none other than the large and rather conspicuous Head and Shoulders pattern born of its own QE1, 2 and OT-LTROed rallies with the combination appearing unlikely to end well despite the best intentions of that pattern’s engineers.
It confirms at about $3.00/lb for a target of about $1.40/lb and quite close to its simplified form and that is none other than the Rising Wedge pattern presenting in risk-on charts everywhere and a pattern that shows the slowing buying momentum of investors who know they are being duped and are willing to tolerate being duped until, very suddenly, they are not as the uncertainty of the sideways Symmetrical Triangle and H&S transforms into outright panic selling.
This – panic selling – is putting it politely, though, considering that copper is still calling for what is more properly called a crash.
