Wall Street and mainstream economists are abuzz with chatter that we’re seeing a recovery in the US due to the latest jobs data. These folks are not only missing the big picture, but they’re not even reading the fine print (more on this in a moment).
The reality is that what’s happening in the US today is not a cyclical recession, but a one in 100 year, secular economic shift.
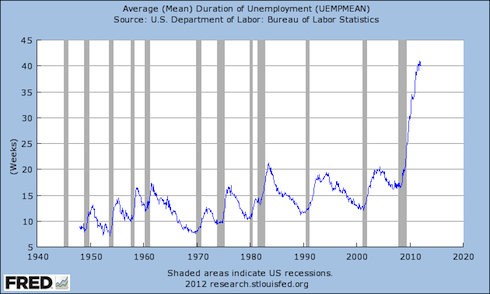
See for yourself. Here’s duration of unemployment. Official recessions are marked with gray columns. While the chart only goes back to 1967 I want to note that we are in fact at an all-time high with your average unemployed person needing more than 40 weeks to find work (or simply falling off the statistics).
Here’s the labor participation rate with recessions again market by gray columns:
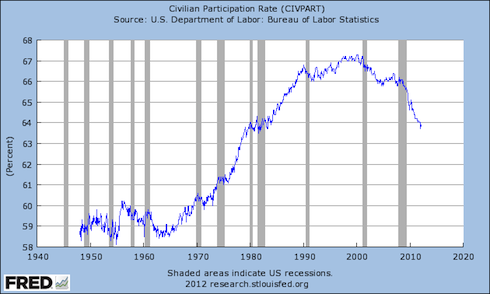
Another way to look at this chart is to say that since the Tech Crash, a smaller and smaller percentage of the US population has been working. Today, the same percentage of the US population are working as in 1980.
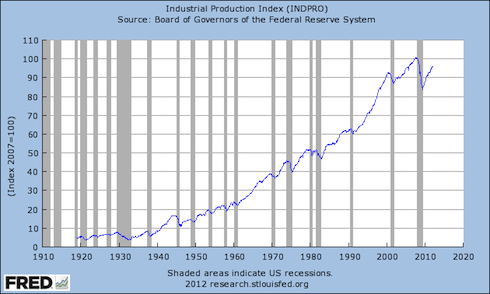
Here’s industrial production. I want to point out that during EVERY recovery since 1919 industrial production has quickly topped its former peak. Not this time. We’ve spent literally trillions of US Dollars on Stimulus and bailouts and production is well below the pre-Crisis highs.
Here’s a close up of the last 10 years.
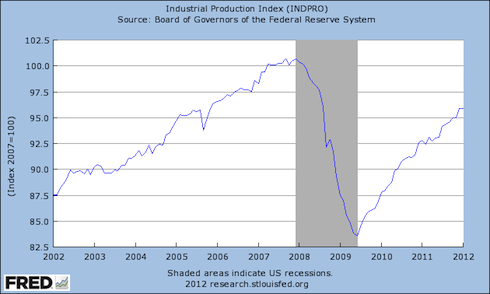
Again, what’s happening in the US is NOT a garden-variety cyclical recession. It is STRUCTURAL SECULAR DEPRESSION.
As for the jobs data… while the headlines claim we’re adding 200K+ jobs per month the sad fact is that without adjustments we’ve lost jobs 1.8 million jobs so far in 2012.
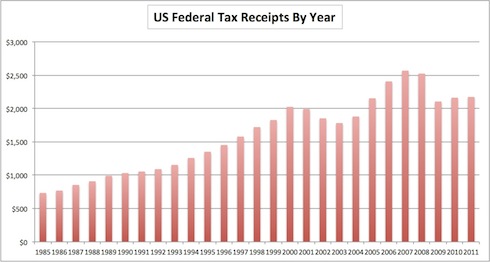
Not only is this data point actually in the JOBS REPORTS THEMSELVES… but it’s supported by the fact that taxes (which are closely tied to actual incomes/ jobs) are in fact below 2005 levels.
Folks, this is a DE-pression. And those who claim we’ve turned a corner are going by “adjusted” AKA “massaged” data. The actual data (which is provided by the Federal Reserve and Federal Government by the way) does not support these claims at all. In fact, if anything they prove we’ve wasted money by not permitted the proper debt restructuring/ cleaning of house needed in the financial system.
It all boils down to the same simple sentence repeated by myself and others: you cannot solve a debt problem by issuing more debt (even if it’s at better rates).
Indeed, take a look at Greece today. The ECB and IMF have spent two years trying to post-pone a real default. Having wasted over €200 billion, they’ve now let Greece stage a pseudo-default (at least in their minds)… which, by the way, has only actually increased Greece’s debt load and crippled its economy.
Just like in the US. And while the topic of a US default is not openly discussed today, it’s evident that what’s happening in Greece will eventually come our way, after first making stop at the other PIIGS countries as well as Japan.
Which is why smart investors are already preparing for a global debt implosion. And they’re doing it by carefully constructing portfolios that will profit from it (while also profiting from Central Bank largesse in the near-term).
The reality is that what’s happening in the US today is not a cyclical recession, but a one in 100 year, secular economic shift.
See for yourself. Here’s duration of unemployment. Official recessions are marked with gray columns. While the chart only goes back to 1967 I want to note that we are in fact at an all-time high with your average unemployed person needing more than 40 weeks to find work (or simply falling off the statistics).

Here’s the labor participation rate with recessions again market by gray columns:

Another way to look at this chart is to say that since the Tech Crash, a smaller and smaller percentage of the US population has been working. Today, the same percentage of the US population are working as in 1980.
Here’s industrial production. I want to point out that during EVERY recovery since 1919 industrial production has quickly topped its former peak. Not this time. We’ve spent literally trillions of US Dollars on Stimulus and bailouts and production is well below the pre-Crisis highs.

Here’s a close up of the last 10 years.

Again, what’s happening in the US is NOT a garden-variety cyclical recession. It is STRUCTURAL SECULAR DEPRESSION.
As for the jobs data… while the headlines claim we’re adding 200K+ jobs per month the sad fact is that without adjustments we’ve lost jobs 1.8 million jobs so far in 2012.
Not only is this data point actually in the JOBS REPORTS THEMSELVES… but it’s supported by the fact that taxes (which are closely tied to actual incomes/ jobs) are in fact below 2005 levels.

Folks, this is a DE-pression. And those who claim we’ve turned a corner are going by “adjusted” AKA “massaged” data. The actual data (which is provided by the Federal Reserve and Federal Government by the way) does not support these claims at all. In fact, if anything they prove we’ve wasted money by not permitted the proper debt restructuring/ cleaning of house needed in the financial system.
It all boils down to the same simple sentence repeated by myself and others: you cannot solve a debt problem by issuing more debt (even if it’s at better rates).
Indeed, take a look at Greece today. The ECB and IMF have spent two years trying to post-pone a real default. Having wasted over €200 billion, they’ve now let Greece stage a pseudo-default (at least in their minds)… which, by the way, has only actually increased Greece’s debt load and crippled its economy.
Just like in the US. And while the topic of a US default is not openly discussed today, it’s evident that what’s happening in Greece will eventually come our way, after first making stop at the other PIIGS countries as well as Japan.
Which is why smart investors are already preparing for a global debt implosion. And they’re doing it by carefully constructing portfolios that will profit from it (while also profiting from Central Bank largesse in the near-term).
