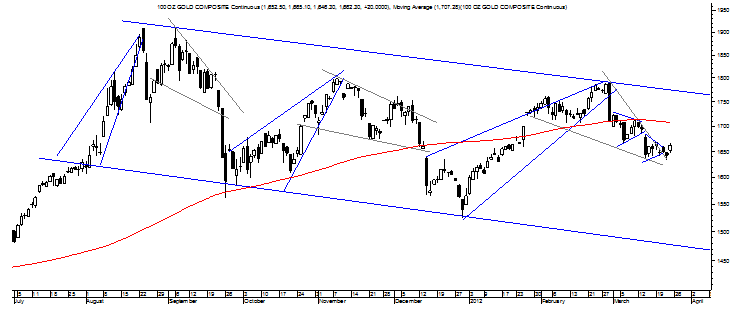
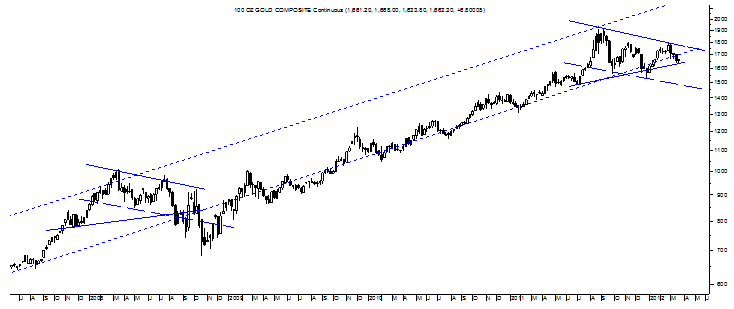
Gold remains well below its 150 DMA and this is an indication of weakness considering how nicely this moving average has tracked long-term support in gold even though this relationship is not depicted so well in the chart below.
However, based on the way that gold’s horizontally-inclined Falling Wedge was drawn earlier this week, gold appears to be moving toward confirmation at $1,711 per ounce and a level that would take gold back above its 150 DMA and conceivably set up gold to fulfill that pattern’s target of $1,790 per ounce in trading action that would take gold above the top trendline of that Descending Trend Channel.
This possibility should be taken very seriously if gold closes above its 150 DMA, but if gold continues to close below its 150 DMA and that initial drawing of the Falling Wedge will have to be widened with it seeming likely that gold might drop violently from its bottom in fulfillment of gold’s initial Bear Pennant and its Rising Wedge that carry targets of $1,484 and $1,525 per ounce, respectively. 
Such a target range is supported by the Descending Trend Channel, and an aspect that shows beautifully in the weekly chart too, as the bottom trendline may try to exert target-like pull over gold.Later this week, its level is around $1,475 per ounce and declining slightly from each week thereafter as indication to where gold might be pulled.
As important in the weekly chart are two other technical aspects and those are gold’s long-term Ascending Trend Channel and its large Symmetrical Triangle.Currently, gold’s position beneath the Ascending Trend Channel is bearish while its position on the bottom trendline of that Symmetrical Triangle would appear to be on the bearish cusp.
Below that trendline at $1,641 per ounce at the end of next week on a closing basis and there will be an early signal that gold may try to fulfill that pattern to the downside.It would be hasty to assume this will be the case, though, and especially in light of gold’s current Falling Wedge and so let’s look at both sides of the Symmetrical Triangle with the upside scenario confirming at about $1,767 per ounce over the next two weeks for a target of $2,192 per ounce while the downside confirms at the aforementioned $1,641 per ounce for a target of $1,219 per ounce.
Put otherwise, gold is about to make a major move in the months ahead that could put gold at $2,200 per ounce or down toward $1,200 per ounce and the best way to watch these extreme scenario that will play out in one direction or the other is by the levels and those appear to be at $1,525 and $1,640 per ounce on the downside and $1,767 and $1,912 per ounce on the upside.
Overall, then, it seems that gold’s getting ready to go extreme with the bearish elements showing most strongly in gold’s charts at this time.
- English (UK)
- English (India)
- English (Canada)
- English (Australia)
- English (South Africa)
- English (Philippines)
- English (Nigeria)
- Deutsch
- Español (España)
- Español (México)
- Français
- Italiano
- Nederlands
- Português (Portugal)
- Polski
- Português (Brasil)
- Русский
- Türkçe
- العربية
- Ελληνικά
- Svenska
- Suomi
- עברית
- 日本語
- 한국어
- 简体中文
- 繁體中文
- Bahasa Indonesia
- Bahasa Melayu
- ไทย
- Tiếng Việt
- हिंदी
Gold’s Getting Ready To Go Extreme
Published 03/25/2012, 05:20 AM
Updated 07/09/2023, 06:31 AM
Gold’s Getting Ready To Go Extreme
3rd party Ad. Not an offer or recommendation by Investing.com. See disclosure here or
remove ads
.
Latest comments
Install Our App
Risk Disclosure: Trading in financial instruments and/or cryptocurrencies involves high risks including the risk of losing some, or all, of your investment amount, and may not be suitable for all investors. Prices of cryptocurrencies are extremely volatile and may be affected by external factors such as financial, regulatory or political events. Trading on margin increases the financial risks.
Before deciding to trade in financial instrument or cryptocurrencies you should be fully informed of the risks and costs associated with trading the financial markets, carefully consider your investment objectives, level of experience, and risk appetite, and seek professional advice where needed.
Fusion Media would like to remind you that the data contained in this website is not necessarily real-time nor accurate. The data and prices on the website are not necessarily provided by any market or exchange, but may be provided by market makers, and so prices may not be accurate and may differ from the actual price at any given market, meaning prices are indicative and not appropriate for trading purposes. Fusion Media and any provider of the data contained in this website will not accept liability for any loss or damage as a result of your trading, or your reliance on the information contained within this website.
It is prohibited to use, store, reproduce, display, modify, transmit or distribute the data contained in this website without the explicit prior written permission of Fusion Media and/or the data provider. All intellectual property rights are reserved by the providers and/or the exchange providing the data contained in this website.
Fusion Media may be compensated by the advertisers that appear on the website, based on your interaction with the advertisements or advertisers.
© 2007-2024 - Fusion Media Limited. All Rights Reserved.
