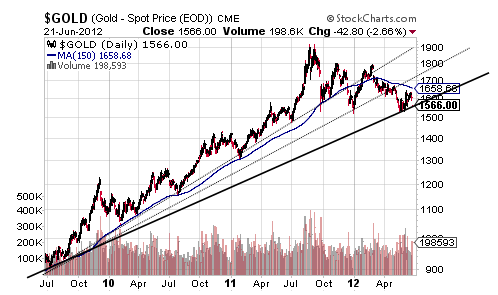
Gold has now spent more continuous time beneath its all-important and used-to-be all-supportive 150 DMA than has occurred in more than a decade and the visual of this bodes poorly for gold with its long-term uptrend starting to reverse down.

It will be a drop below that third Bear Fan Line, though, that will provide strong technical proof of gold’s long-term uptrend reversing right around $1,550 per ounce but to be safe at $1,524 per ounce.
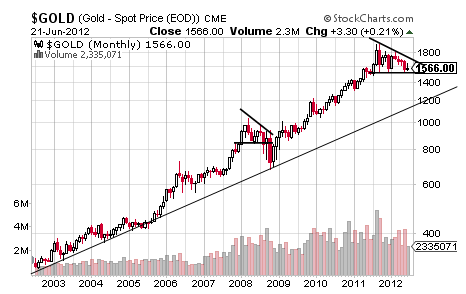
Taking gold down to reverse its long-term uptrend and something that is only a matter of time with gold’s latest and unsuccessful attempt to reclaim its 150 DMA is a bearish Descending Triangle that was born of a Symmetrical Triangle that has begun to break to the downside with the former pattern carrying a target of about $1,136 per ounce.

In the monthly chart above, it is obvious that the last real Descending Triangle was a successful bearish aspect and one that caused a more than 20% drop in gold back in 2008 while the current pattern, and a larger pattern on an absolute and percentage basis, is promising a nearly 30% drop from Friday’s close and a more than 40% decline from last August.
Supporting the Descending Triangle is a monthly Pipe Top that confirms at $1,525 per ounce for nearly the exact target at $1,136 per ounce with the two patterns being entirely different, and thus providing confirmation around the likelihood of gold’s big drop unless it stages a miraculous comeback back above its record nominal high at $1,912 per ounce and something that should be considered only if gold closes back above its 150 DMA.
Otherwise, it is quite fair and really very generous to say that gold is going to $1,200 in 2012.

It will be a drop below that third Bear Fan Line, though, that will provide strong technical proof of gold’s long-term uptrend reversing right around $1,550 per ounce but to be safe at $1,524 per ounce.
Taking gold down to reverse its long-term uptrend and something that is only a matter of time with gold’s latest and unsuccessful attempt to reclaim its 150 DMA is a bearish Descending Triangle that was born of a Symmetrical Triangle that has begun to break to the downside with the former pattern carrying a target of about $1,136 per ounce.

In the monthly chart above, it is obvious that the last real Descending Triangle was a successful bearish aspect and one that caused a more than 20% drop in gold back in 2008 while the current pattern, and a larger pattern on an absolute and percentage basis, is promising a nearly 30% drop from Friday’s close and a more than 40% decline from last August.
Supporting the Descending Triangle is a monthly Pipe Top that confirms at $1,525 per ounce for nearly the exact target at $1,136 per ounce with the two patterns being entirely different, and thus providing confirmation around the likelihood of gold’s big drop unless it stages a miraculous comeback back above its record nominal high at $1,912 per ounce and something that should be considered only if gold closes back above its 150 DMA.
Otherwise, it is quite fair and really very generous to say that gold is going to $1,200 in 2012.
