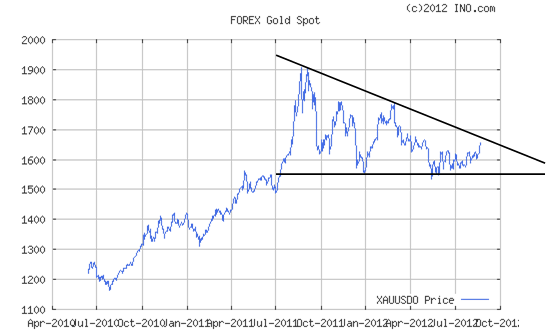
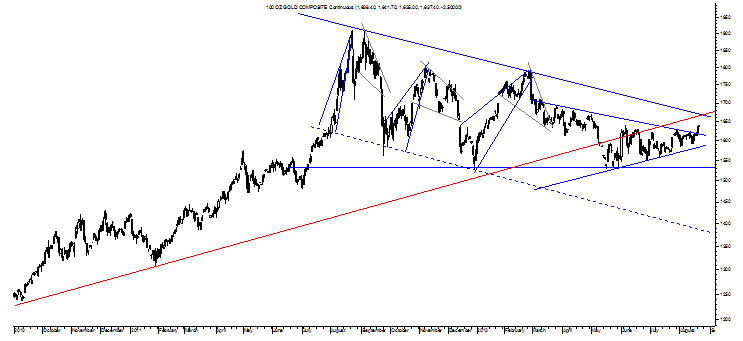
Even so, gold is only filling out a massive and bearish pattern on its recent move up as shown in the charts below.

Gold’s daily chart above captures the entirety of the post-FOMC minutes move thus far with the Descending Triangle’s top trendline allowing for just a bit more of a move up and something support by this pattern shown in greater detail through yesterday’s close in the chart below.

Specifically, the daily chart of gold above seems to suggest that gold will rise to about $1,669 per ounce before making what will be a huge break up or down on that massive pattern of bearishly trending confusion.
Making it bearish is not just its descending but converging nature but the fact that gold’s two-year uptrend is reversing as shown below the trendline in red. Interesting about that trendline is its right-about-now convergence with the top trendline of the Descending Triangle and something that emphasizes just how big the upcoming move will be.
Its timing would seem to coincide well with August 31’s Jackson Hole event where Fed Chairman could stir the hearts of gold bugs everywhere by indicating that another round of bond buying is on the way even though there is no threat of deflation at this time as measured by the TIPS spread with this very real threat having been the trigger for QE1 and QE2.
Clearly any such QE-Nod in Wyoming would cause gold’s Symmetrical Triangle to confirm at $1,671 per ounce and fulfill toward its upside target of $1,893 per ounce and a level that would nearly bring the Descending Triangle to confirm its conservative upside target of $2,200 per ounce.
On the other hand, maybe Mr. Bernanke plays it cool in Jackson Hole as had been the case last year and this could be the very thing to send gold toward the top trendline of the Descending Triangle and then back down into it.
This would put the focus on the Symmetrical Triangle confirming to the downside at $1,529 per ounce for its target of $1,349 per ounce while the Descending Triangle shares the same confirmation level essentially but for a much lower target of $1,136 per ounce.
It’s hard to know how this one will break unless one knows with certainty whether or not Mr. Bernanke would make what would seem like a strategic error by inflating a successfully reinflated environment rather than keeping that policy response for another nearing-deflationary time in true need of reinflating.
Last year, Mr. Bernanke did the right thing by offering a policy response that was appropriate and fitting to the circumstances and perhaps this provides reason to think this will occur again this year and something that means QE will not be promised next Friday, in September and probably not even in November and December considering how successful the aforementioned reinflation off of twisting and words alone has been.
Maybe Mr. Bernanke breaks from that mold, though, and the real criterion for QE1 and QE2, but if not, gold should drop on downside fulfillments of the patterns discussed above and this would mean that gold’s galvanization by the Fed would prove to be quite brief.

Gold’s daily chart above captures the entirety of the post-FOMC minutes move thus far with the Descending Triangle’s top trendline allowing for just a bit more of a move up and something support by this pattern shown in greater detail through yesterday’s close in the chart below.

Specifically, the daily chart of gold above seems to suggest that gold will rise to about $1,669 per ounce before making what will be a huge break up or down on that massive pattern of bearishly trending confusion.
Making it bearish is not just its descending but converging nature but the fact that gold’s two-year uptrend is reversing as shown below the trendline in red. Interesting about that trendline is its right-about-now convergence with the top trendline of the Descending Triangle and something that emphasizes just how big the upcoming move will be.
Its timing would seem to coincide well with August 31’s Jackson Hole event where Fed Chairman could stir the hearts of gold bugs everywhere by indicating that another round of bond buying is on the way even though there is no threat of deflation at this time as measured by the TIPS spread with this very real threat having been the trigger for QE1 and QE2.
Clearly any such QE-Nod in Wyoming would cause gold’s Symmetrical Triangle to confirm at $1,671 per ounce and fulfill toward its upside target of $1,893 per ounce and a level that would nearly bring the Descending Triangle to confirm its conservative upside target of $2,200 per ounce.
On the other hand, maybe Mr. Bernanke plays it cool in Jackson Hole as had been the case last year and this could be the very thing to send gold toward the top trendline of the Descending Triangle and then back down into it.
This would put the focus on the Symmetrical Triangle confirming to the downside at $1,529 per ounce for its target of $1,349 per ounce while the Descending Triangle shares the same confirmation level essentially but for a much lower target of $1,136 per ounce.
It’s hard to know how this one will break unless one knows with certainty whether or not Mr. Bernanke would make what would seem like a strategic error by inflating a successfully reinflated environment rather than keeping that policy response for another nearing-deflationary time in true need of reinflating.
Last year, Mr. Bernanke did the right thing by offering a policy response that was appropriate and fitting to the circumstances and perhaps this provides reason to think this will occur again this year and something that means QE will not be promised next Friday, in September and probably not even in November and December considering how successful the aforementioned reinflation off of twisting and words alone has been.
Maybe Mr. Bernanke breaks from that mold, though, and the real criterion for QE1 and QE2, but if not, gold should drop on downside fulfillments of the patterns discussed above and this would mean that gold’s galvanization by the Fed would prove to be quite brief.
