- S&P 500 managed to post a new marginal weekly closing high last week. However, this "break out" was accomplished on very low volume, indicating hesitation and non-commitment. Most importantly, momentum is slowing as seen from measuring the distance between the S&P and its 200-day MA. Historically, bearish divergence like that usually indicates price weakness.
- According to the Technical Take blog, Rydex fund inflows towards the equity market are once again at extreme levels. From a contrarian perspective, the current readings were last seen in March 2012. What is also important to note is that the correction in May of this year failed to create enough fear (outflows), unlike the previous bottoms in July 2010 and August 2011.
- Despite the EU issues calming for the time being, corporate credit markets continue to show non-confirming signals towards the equity market. In particular, I am focused on Junk Bond spreads and Credit Default Swaps, both of which remain elevated. While the S&P has managed a new intra day bull market high this week, credit markets have not returned to 2011 lows.
- Leading into the Jackson's Hole meeting next weekend, hedge funds have cut U.S. Dollar net long positions to a neutral level. Interestingly, if we disregard the extreme Euro positioning, hedge funds are actually heavily shorting the US Dollar. So where is the money flowing towards? Hedge funds absolutely love commodity currencies, with net long bets close to record highs.
- Gold and Silver are attempting to break above the 200 day moving average. Gold has spent half a year below its main trend, while Silver has spent almost a full year below its main trend. With prices now overbought in the short term, the next movement will signal whether bulls or bears are in control with either a consolidation of the recent gains or a quick reversal of the breakout.
- Iron Ore and Steel prices are crashing as Chinese economy continues to slow further. Iron Ore is down almost 50% from its peak in February 2011, around the same time that Copper peaked. The mining boom in Australia is now experiencing a serious downturn according to the CEO of BHP Billiton, posing further risks to the national housing bubble and over-leveraged consumer.
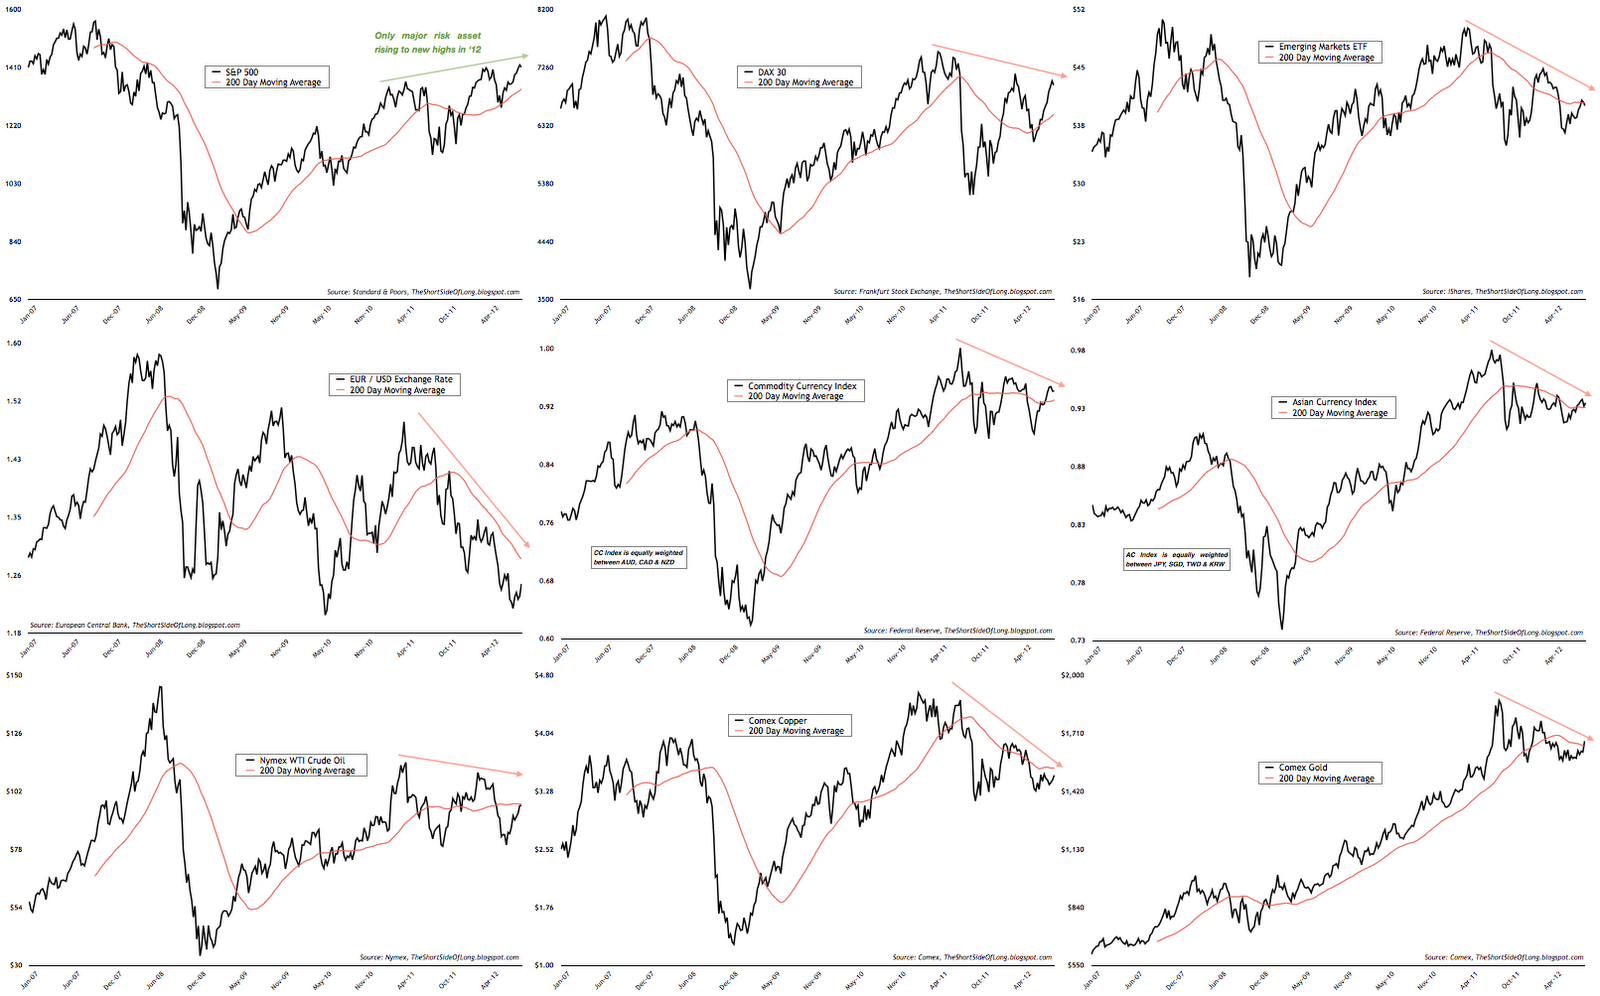
We continue to see that industrial economic barometers like Copper and Crude Oil are failing to rise above their 200-day MA and more importantly are not confirming the S&P 500's new highs in 2012. The Emerging Markets, saviour of global growth in the post Lehman recovery, also continue to lag other equity indices indicating that not all is well with the BRICs. Furthermore, the short term rise in the DAX 30, Commodity Currencies and Brent Crude Oil (not shown here) has been almost vertical, so caution is advised. Finally, Gold, Silver and Platinum have technically broken out to the upside, but the real test will be coming as global risk asset volatility rises and if the U.S. Dollar starts to rally again.
Leading Indicators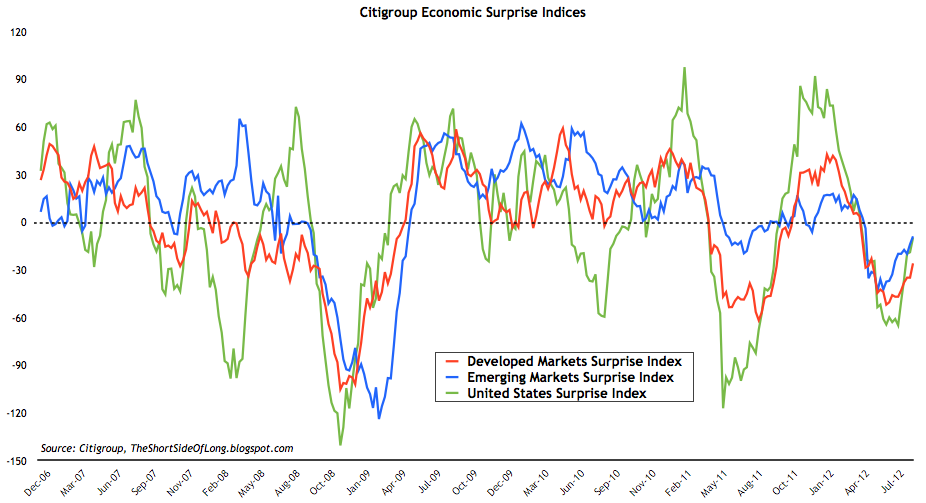
The Citigroup Economic Surprise Indices are still in mean reversion mode towards the upside, which means the incoming global economic data continues to surprise economist's expectations. Majority of risk assets have done well coming out of the June lows. However, keep in mind that this indicator does not actually state whether or not the global economy is improving, but rather if the data is coming in below or above economist's expectations. In my opinion, despite the improvement in the chart above, economic activity tracked by leading indicators continues to decelerate globally.
The chart below shows the Philly Fed State Coincident Index, thanks to the Calculated Risk blog, which tracks cumulative economic activity in various states throughout the U.S. The indicator has an above average success rate in recession forecasting, even though it is of a coincident nature. The reasoning behind this is that the indicator breaks down the U.S. economy into components, similar to the way one can break down the stock market into sectors. Just the way sectors start weakening prior to a bear market, dropping off one by one, a similar occurrence is seen with the Philly Fed State Coincident Index below.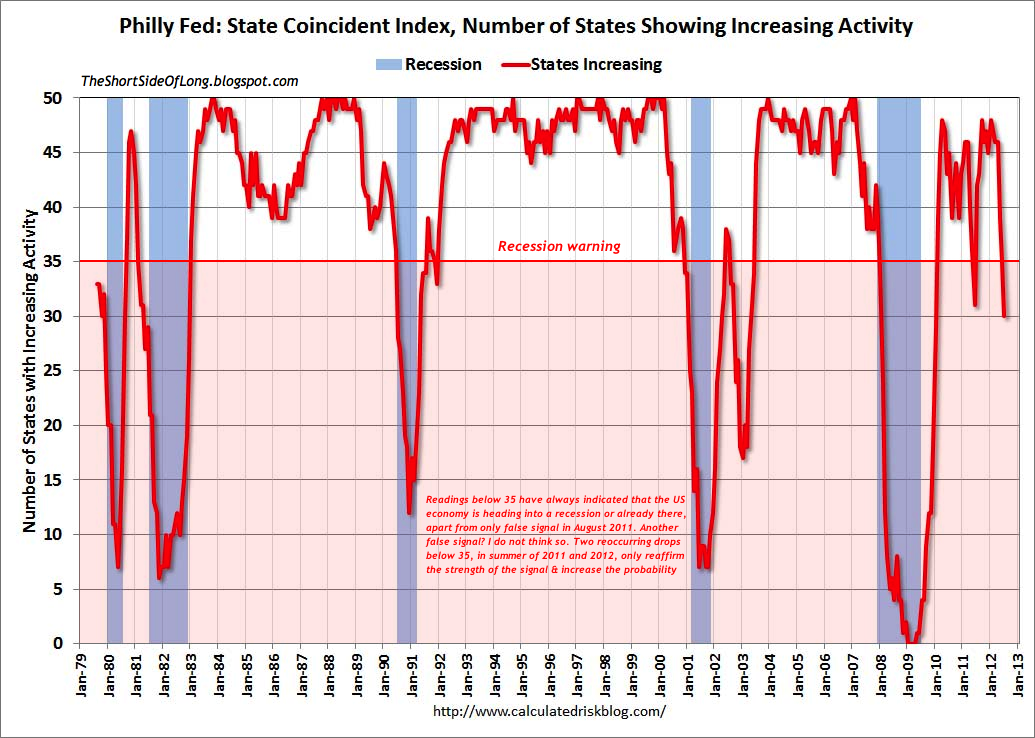
The current July readings show that there are now 30 states within the U.S. showing improvement in economic activity, which is only 60% of the overall economy. Historically, whenever readings dropped below 35 states or 70% of the overall economy, the U.S. has always entered a recession (apart from the false signal during the summer of last year). Many would claim that since this indicator let us down last year, it can easily flash another false signal. That is true. However, there are two observations I would like to make:
- This time last year, the global economy was in better shape, especially the core European nations as well as the Emerging Markets. This year that is not the case as Germany is on the brick of recession, the Netherlands is experiencing a housing crash, India and China are moving towards a hard landing, Brazil is not growing at all and finally Commodity exporters are feeling the slowdown due to industrial metal slump.
- Focusing on the Philly Fed indicator itself, one can make a case that while last year's signal was false, two reoccurring signals in a row (summer of 2011 and summer of 2012) most likely reaffirm weakness in the economy and increase the probability of a recession just around the corner. Either that or the reliability signal has lost its charm. As the old saying goes... fool me once, shame on you; fool me twice, shame on me.
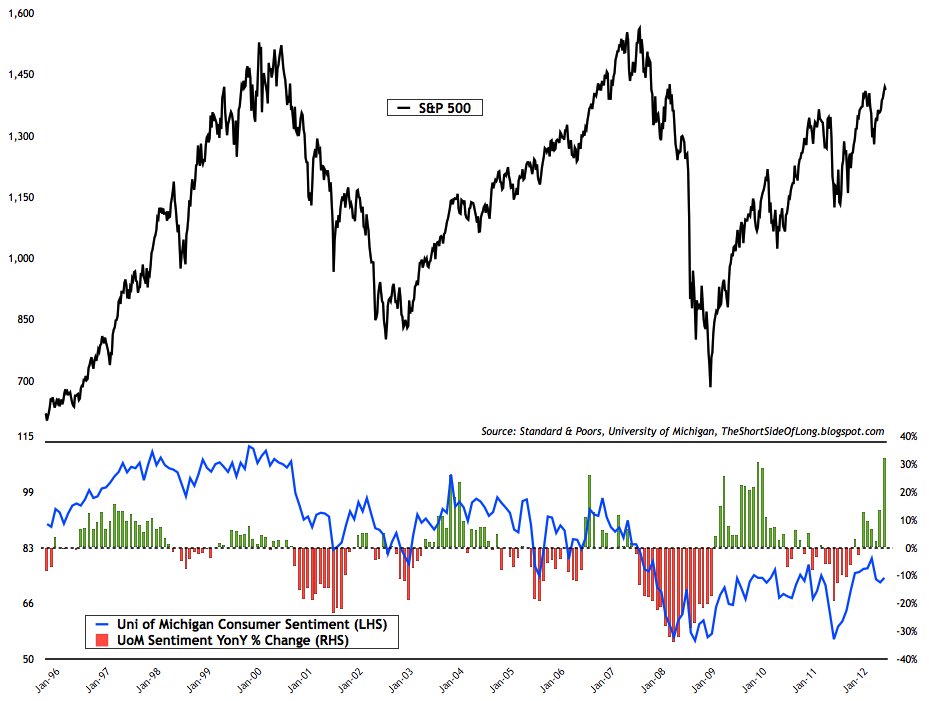
If I can be plain and general about the state of economic prospects, market bulls continue to claim that everyone, everywhere is extremely negative on everything -- and that is why stocks can go up even if the economy remains weak. Let's face it, that has some merit to it, because the general state of the U.S. economy is a far cry from the late 1990s and the stock market has gone nowhere for 12 years. Having said that, if we look at the chart above, we can see that consumers are much more positive than they were a year ago. A general rule of thumb I practice as an investor is to refrain from buying stocks when the public is optimistic about future prospects, unless of course the economy is coming out of a recession (2001/02 & 2008/09). Since we are late in the business cycle and a recession is most likely around the corner, I personally feel that the short term optimism shown by consumers is unwarranted and will most likely prove to be a contrarian indicator.
Featured Article
This week's feature post looks at hedge funds and other speculator positioning within the commodity market, thanks to the CTFC Commitment of Traders reports. The focus is mainly in the Energy and Agriculture space, where the CRB Index has 66% or two thirds of its weighting. For those that missed out, an extensive Copper update was covered in the last post and the Precious Metals sector will be covered sometime in the near future.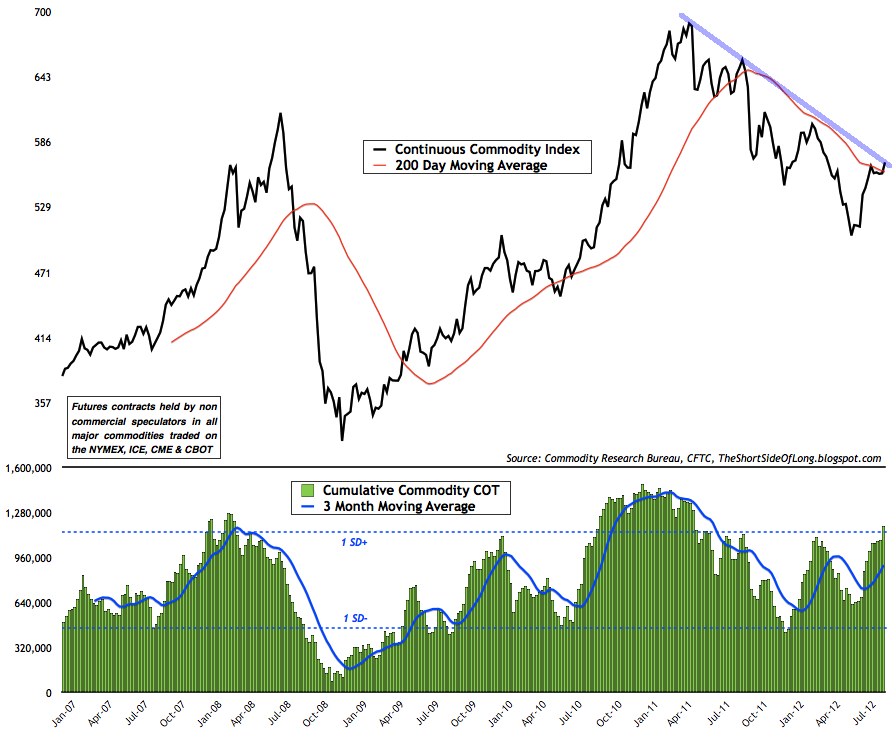
The Continuous Commodity Index (equally weighted), finds itself at a downtrend resistance right now. Before we discuss what hedge funds think, my personal observation is that the CCI June bottom was a very technically unreliable V trough reversal. At the same time, hedge funds have increased bullish bets towards and above one standard deviation from the mean, obviously not phased by this. Statistically, this is the eleventh straight week of hedge funds increasing cumulative net longs. While some of the positioning increases have been justified due to skyrocketing Grain prices, majority of the bullish positioning seems to be added with the hope that QE3 will occur sooner rather than later. Let us investigate further: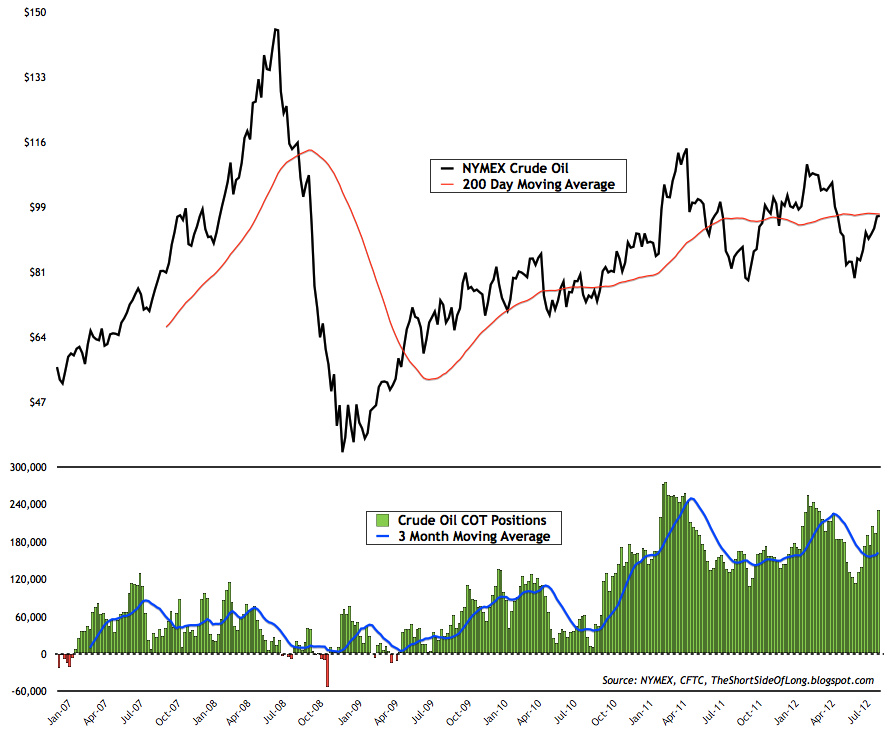
- Energy: I have to express my amazement at the current bullish positioning towards Crude Oil, a major component of the overall CRB Index (23% - roughly one quarter weighting). This week we've learned that hedge funds and other speculators hold close to record net long bets. So I ask myself - on the back of what fundamentals? The Eurozone is slowly but surely entering a recession. The U.S. is experiencing limited growth and flirting with stall speed. Finally and most importantly Asia, the marginal buyer of Crude Oil (demand charts here & here), is also slowing down seriously and at risk of a hard landing. Therefore, it must be something to do with "QE3 hope". Technically, Crude Oil's 200 MA has remained flat for over a year expressing global growth stall speed. The price range has been bound between the $75 support on the downside and the $110 resistance on the upside. Not if, but when economic activity slows further, I'd expect current positions to be quickly and rapidly unwound in a forceful downswing, similar to May 2012. Furthermore, Natural Gas looks like a much better long term investment right now.
- Side note: Upside risk for Crude Oil always remains with confrontation building between Israel and Iran...
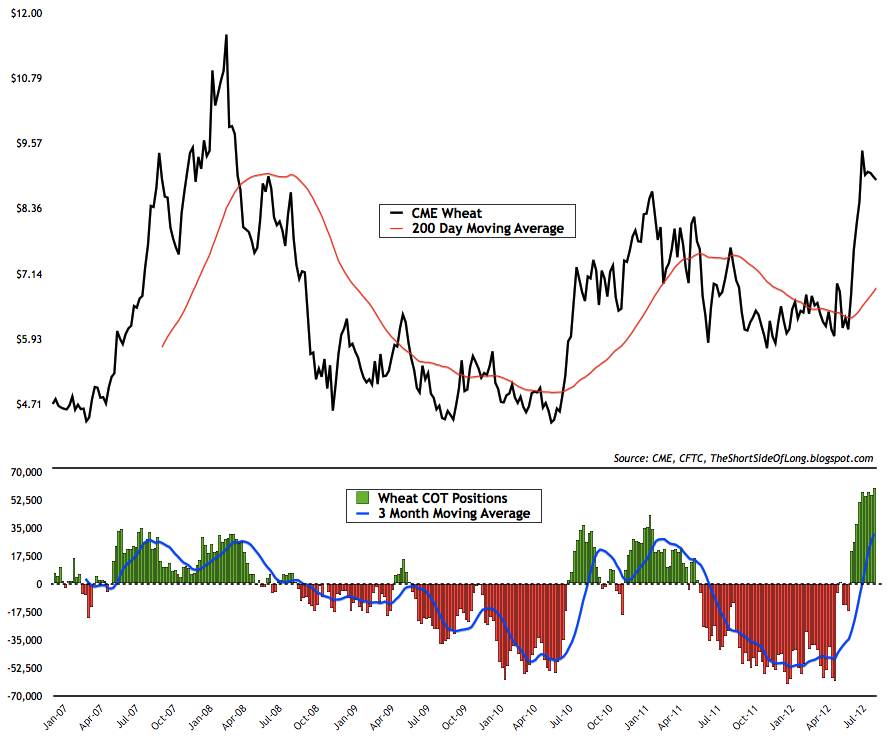
- Grains: For over a year hedge funds were extremely negative on the price of Grains while media consistently ran oversupply reports. Grains were written off by the consensus, but underneath the surface a huge opportunity was brewing based on long term fundamentals, which I last warned about in May 2012. The catalyst for the rally was the U.S. drought, but the fact of the matter is that almost all Agricultural inventories are approaching record low levels. Today, the prices of Soybeans and Corn have made all time new highs, which signals that the Agricultural bull market is alive and well. However, from a shorter term perspective as recently as this week hedges funds hold extremely bullish bets on Wheat (seen above) as well as in Soybeans. It is never a wise idea to jump into a vertically rising trend, when the consensus is extremely bullish and bidding up prices. A consolidation or a correction is to be expected in the near future. Finally, Corn's net long positioning is a little bit more modest and therefore further upside could exist.
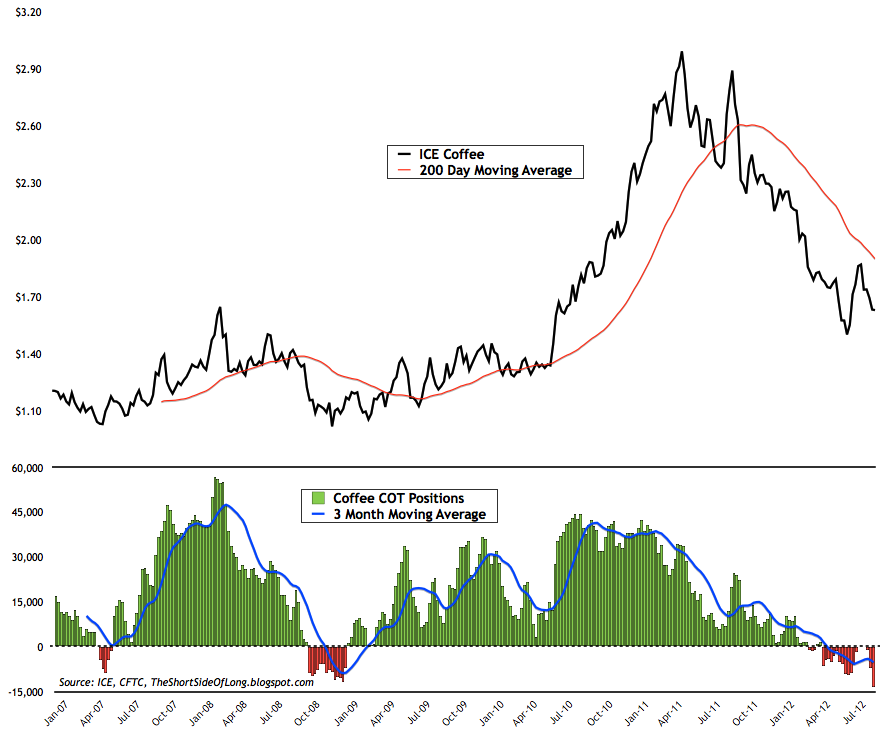
- Softs: When we look at the performance of Soft commodities over the last 12 to 18 months, it has been disastrous. The QE 2 inflation trade of 2010/11 spilled over into the Softs market and created parabolic rises in Coffee (chart above) as well as in Cotton. Weather problems, supply issues and Bernanke's bond buying created a perfect storm. Hedge funds were pilling in over each other pushing prices even higher as greed feeds more greed. A big crash followed. Fast forward to today and the picture has dramatically changed. The chart above shows that the current positioning held by hedge funds on Coffee is the most bearish in at least five years. Hedge funds are also consistently net short Cotton for the first time since March 2009. With the majority of farmers planting Grains due to high prices, Cotton fundamentals continue to improve as the supply side is seriously neglected by farmers, due to very low prices. Finally, Sugar has been in a bear market for over 18 months, since February 2011, but hedge funds still remain stubbornly net long. All in all, unlike the possibly of a correction in Energy and Grains sectors, I'd expect that the Softs market has already started some type of a bottoming process and presents better value for a long term investor.
- Outlook: I am of the opinion that the risk asset bear market is upon us and that the global economy continues to slow rapidly into a recession. United States GDP has grown five out of the last six quarters below 2%, which tends to be stall speed. German GDP is also at stall speed, similar to 2008. China and India are slowing meaningfully and could experience a serious hard landing. At the same time U.S. corporate earnings and gross profit margins are at record highs, so I expect a mean reversion unlike so many stock analysts. Cash levels with mutual funds, retail investors and money market funds are at extreme lows, financial stress is starting to rise, volatility is at very complacent levels and credit spreads are very narrow relative to fundamentals, so I expect a risk off scenario in due time.
- Long Positioning: Long focus is towards secular commodity bull market, with Precious Metals and Agriculture offering the best value. Largest commodity position is held in Silver, as central banks will eventually print money as the global economic activity deteriorates. Since Silver has broken out recently, hedges have been removed and a small purchase was made. Any negative reversal, as global risk asset volatility rises, will call for hedging again. NAV long exposure is about 100%.
- Short Positioning: Short focus is towards secular equity bear market, with cyclical sectors and credit offering best selling opportunities due to deteriorating global growth. Mild to modest exposure is held short in the Junk Bond market, as well as various economically sensitive cyclical sectors like Technology, Discretionary and Dow Transportation. Recently, the Apple parabolic has been shorted with long dated 2014 OTM puts. NAV short exposure is about 60%.
- Watch-list: Commodity currencies like Aussie, Kiwi and Loonie are also on my watch list of potential shorts right now, as negative surprises await with China slowing dangerously. With Euro being the most hated currency, a better risk off trade could be selling the British Pound. A major short in due time will be U.S. Treasury long bonds, as they are extremely overbought and in a mist of a huge bubble mania, but first we have to wait for the Eurozone dust to settle. Finally, while Grains have exploded up, Softs still present amazing value for long term investors, with Sugar being my second favourite commodity (after Silver).
