
The latest Ceridian-UCLA Pulse of Commerce Index (PCI), a measure of the economy based on diesel fuel consumption, is now available. The published report highlights the 1.1% increase in October with a cautionary subtitle "But decline in August leaves the three-month moving average still falling."
Here is an excerpt from the report followed by a pair of charts to illustrate the behavior of this indicator, the second of which adjusts for population growth.
The Ceridian-UCLA Pulse of Commerce Index (PCI), issued today by the UCLA Anderson School of Management and Ceridian Corporation rose 1.1 percent in October after three consecutive negative months: -1.0 in September, -1.4 percent in August and -0.2 percent in July.
The October data offers a welcome relief from the double-dip fears that were rampant a month ago, but one month does not mean a new trend. Until we get a series of positive months, it remains a she-loves-me, she-loves-me-not economy with bad news followed by good followed by bad.
Moreover, the positive month-on-month news in October is relative to a very disappointing September result. Though the growth in October offsets the September decline, it doesn’t offset the cumulative decline including August and July. The average of the last three months has declined compared with the previous three months at an annualized rate of 5.8 percent, and the PCI remains lower than it was during most of the first half of 2011.
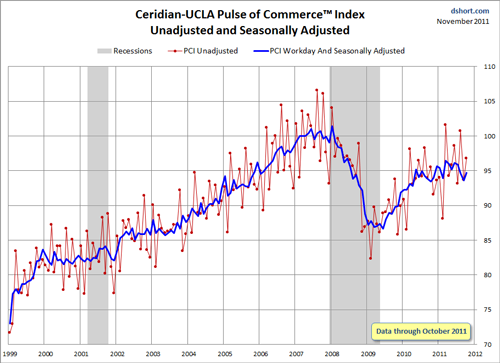
The first chart shows the PCI index unadjusted and seasonally adjusted. As we can readily observe, the index had been trending up since end of the Great Recession, but it has yet to achieve the highs of the immediate pre-recession months and now appears stalled. In fact, we're tracking at approximately the same range as November 2005.
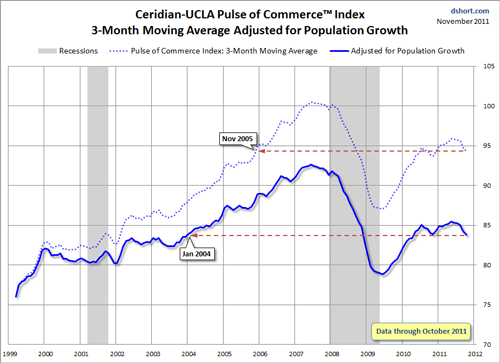
In the chart below the 3-month moving average of the PCI is shown with the dotted blue line. The solid line is the same moving average of the data series adjusted for population growth based on the Bureau of Economic Analysis mid-month population data, which is available from the St. Louis Federal Reserve.
Here is an excerpt from the report followed by a pair of charts to illustrate the behavior of this indicator, the second of which adjusts for population growth.
The Ceridian-UCLA Pulse of Commerce Index (PCI), issued today by the UCLA Anderson School of Management and Ceridian Corporation rose 1.1 percent in October after three consecutive negative months: -1.0 in September, -1.4 percent in August and -0.2 percent in July.
The October data offers a welcome relief from the double-dip fears that were rampant a month ago, but one month does not mean a new trend. Until we get a series of positive months, it remains a she-loves-me, she-loves-me-not economy with bad news followed by good followed by bad.
Moreover, the positive month-on-month news in October is relative to a very disappointing September result. Though the growth in October offsets the September decline, it doesn’t offset the cumulative decline including August and July. The average of the last three months has declined compared with the previous three months at an annualized rate of 5.8 percent, and the PCI remains lower than it was during most of the first half of 2011.
The first chart shows the PCI index unadjusted and seasonally adjusted. As we can readily observe, the index had been trending up since end of the Great Recession, but it has yet to achieve the highs of the immediate pre-recession months and now appears stalled. In fact, we're tracking at approximately the same range as November 2005.
In the chart below the 3-month moving average of the PCI is shown with the dotted blue line. The solid line is the same moving average of the data series adjusted for population growth based on the Bureau of Economic Analysis mid-month population data, which is available from the St. Louis Federal Reserve.
Interpreting the Data
"Until we get a series of positive months, it remains a she-loves-me, she-loves-me-not economy with bad news followed by good followed by bad" says the report. October was a good month, which will be seen by optimistic economists as evidence that the latest recession call of the ECRI is in error. On the other hand, the workday and seasonally adjusted three-month moving average of the index is in fact stalled at the pre-recession level of November 2005. Moreover, on a population adjusted basis, the current index level is about where it was in January 2004.3rd party Ad. Not an offer or recommendation by Investing.com. See disclosure here or
remove ads
.