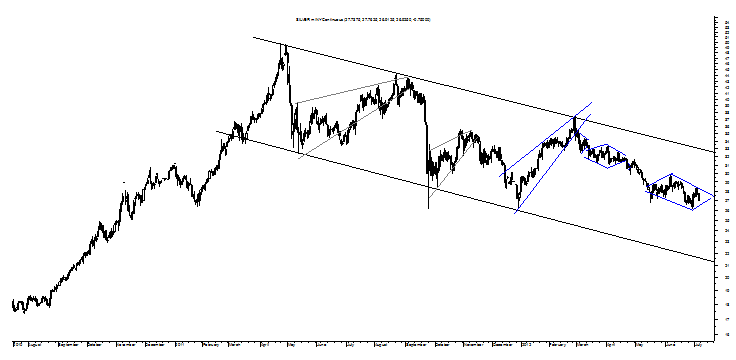
Silver, like gold, appears to be breaking the pattern repetition responsible for its year-long but still-sideways Descending Trend Channel.

Rather than trying to make another top trendline touch on an ultimately bearish Rising Wedge, silver has traded into yet another Diamond Bottom and a pattern that should break to the upside but looks more prone to a break to the downside as occurred with silver’s last Diamond Bottom with the current pattern being the equivalent of the small Symmetrical Triangle that was just discussed around gold.
Let’s treat both sides of silver’s Diamond Bottom with its chart looking less set for some sideways trading and more set for a real break from this directionless trading soon with upside confirmation coming at $29.85 for a target of $33.59 per ounce and a level that is a bit above the top of the Descending Trend Channel while the downside confirms at $26.11 for a target of $22.37 per ounce and just a bit above the top of the Channel.
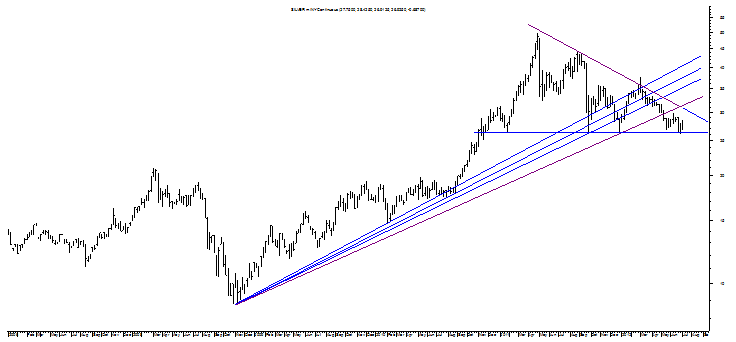
Neither target is a perfect match for a bullish or bearish touch of that bearish and-yet-still-sideways aspect and so let’s turn to the weekly to see what light it might shed on what way sideways-to-down might take silver next and, not too surprisingly, it suggests that down will have it.
In looking at the weekly chart on the following page, there are few bearish aspects that stand out and are worth noting.
First, silver’s long-term uptrend is officially reversing with its breach of not just the all-important third Bear Fan Line but of the fourth Bear Fan Line with a fifth possible to draw but something that would clutter an already crowded chart.
Second, silver is fulfilling its large Symmetrical Triangle in purple to the downside if its chart is interpreted in that vein for an obscene single digit target.

Third, silver’s stronger long-term technical aspect is a different interpretation of the weak Symmetrical Triangle and that is a Descending Triangle that is on the cusp of confirming at $26.11 per ounce for a sub-$10 per ounce target and one that is so low it would not be believed by most even though it would simply reflect an equal and opposite reaction to silver’s QE1 and QE2 move up.
What seems less believable to me, though, is silver using the consolidation of that Symmetrical Triangle to power toward its upside target of $73.41 per ounce even though, funny enough, there is a bit of a bullish Falling Wedge at play within the Descending Triangle. This very bullish pattern possibility can be taken seriously, though, only if silver closes above $37.55 per ounce with that aspect carrying a target of the frothy days of $49.78 per ounce and this puts some focus on silver’s Diamond Bottom carrying it up potentially.
Naturally anything is possible and this includes silver taking a second distinct shot on its more than thirty-year nominal record high but this seems less likely against the backdrop of a slowing global economy and something that should result in decreased demand for silver whether for its industrial uses or in jewelry along with slicing into investor perception that silver is an alternative currency. Should this occur, it is likely to result in a major sell-off in silver as investors seek to get liquid in the face of a worst case scenario even if a doomsday does not arrive and even if this fear does not take silver sub-$10 per ounce.
It will take silver down, though, with degree being the question with it seeming quite likely that the entire QE2 rally in silver will be reversed to take silver back down toward $17 per ounce or so making it seem that silver will sink sub-$20 at an absolute minimum.
Rather than thinking too much about the “whats” and “whys” behind silver’s trading, though, let’s just focus in on levels considering that there is possibly some almost invisible bullish play behind the scenes of silver’s more outwardly bearish Descending Triangle and those broad levels are the ones already mentioned at $26.11 per ounce and $37.55 per ounce.
Above the latter level and silver will make many headlines as it will take on its record nominal high, again, but perhaps successfully this time around but below the former level and silver will make headlines of another sort and those will be of yet-another bubble bursting and this will be an interesting bull and bear battle to watch.
Sadly, as it would be fun to get on board another silver rally again and even more fun to stay on a bit longer, it appears that silver is set to slide to $17.

Rather than trying to make another top trendline touch on an ultimately bearish Rising Wedge, silver has traded into yet another Diamond Bottom and a pattern that should break to the upside but looks more prone to a break to the downside as occurred with silver’s last Diamond Bottom with the current pattern being the equivalent of the small Symmetrical Triangle that was just discussed around gold.
Let’s treat both sides of silver’s Diamond Bottom with its chart looking less set for some sideways trading and more set for a real break from this directionless trading soon with upside confirmation coming at $29.85 for a target of $33.59 per ounce and a level that is a bit above the top of the Descending Trend Channel while the downside confirms at $26.11 for a target of $22.37 per ounce and just a bit above the top of the Channel.
Neither target is a perfect match for a bullish or bearish touch of that bearish and-yet-still-sideways aspect and so let’s turn to the weekly to see what light it might shed on what way sideways-to-down might take silver next and, not too surprisingly, it suggests that down will have it.
In looking at the weekly chart on the following page, there are few bearish aspects that stand out and are worth noting.
First, silver’s long-term uptrend is officially reversing with its breach of not just the all-important third Bear Fan Line but of the fourth Bear Fan Line with a fifth possible to draw but something that would clutter an already crowded chart.
Second, silver is fulfilling its large Symmetrical Triangle in purple to the downside if its chart is interpreted in that vein for an obscene single digit target.

Third, silver’s stronger long-term technical aspect is a different interpretation of the weak Symmetrical Triangle and that is a Descending Triangle that is on the cusp of confirming at $26.11 per ounce for a sub-$10 per ounce target and one that is so low it would not be believed by most even though it would simply reflect an equal and opposite reaction to silver’s QE1 and QE2 move up.
What seems less believable to me, though, is silver using the consolidation of that Symmetrical Triangle to power toward its upside target of $73.41 per ounce even though, funny enough, there is a bit of a bullish Falling Wedge at play within the Descending Triangle. This very bullish pattern possibility can be taken seriously, though, only if silver closes above $37.55 per ounce with that aspect carrying a target of the frothy days of $49.78 per ounce and this puts some focus on silver’s Diamond Bottom carrying it up potentially.
Naturally anything is possible and this includes silver taking a second distinct shot on its more than thirty-year nominal record high but this seems less likely against the backdrop of a slowing global economy and something that should result in decreased demand for silver whether for its industrial uses or in jewelry along with slicing into investor perception that silver is an alternative currency. Should this occur, it is likely to result in a major sell-off in silver as investors seek to get liquid in the face of a worst case scenario even if a doomsday does not arrive and even if this fear does not take silver sub-$10 per ounce.
It will take silver down, though, with degree being the question with it seeming quite likely that the entire QE2 rally in silver will be reversed to take silver back down toward $17 per ounce or so making it seem that silver will sink sub-$20 at an absolute minimum.
Rather than thinking too much about the “whats” and “whys” behind silver’s trading, though, let’s just focus in on levels considering that there is possibly some almost invisible bullish play behind the scenes of silver’s more outwardly bearish Descending Triangle and those broad levels are the ones already mentioned at $26.11 per ounce and $37.55 per ounce.
Above the latter level and silver will make many headlines as it will take on its record nominal high, again, but perhaps successfully this time around but below the former level and silver will make headlines of another sort and those will be of yet-another bubble bursting and this will be an interesting bull and bear battle to watch.
Sadly, as it would be fun to get on board another silver rally again and even more fun to stay on a bit longer, it appears that silver is set to slide to $17.
