We spend a great deal of time emphasizing the importance of maintaining a big picture perspective as both investors and traders. Without an understanding of the secular and cyclical environments within which the financial markets are operating, it is not possible to accurately measure the potential risk and reward of investment and trading positions.
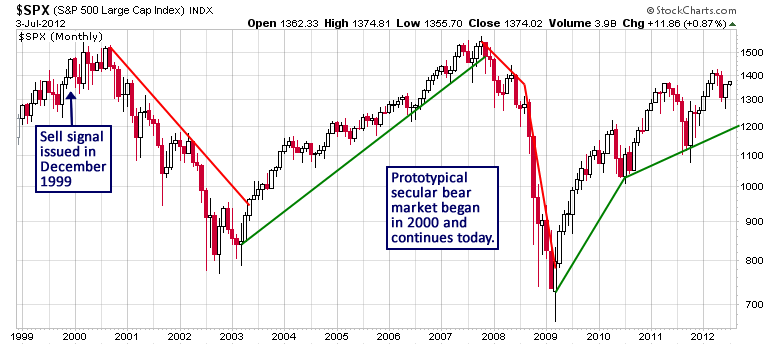
The stock market has been in a secular bear market since 2000. Market behavior clearly signaled that a secular inflection point was approaching and our Secular Trend Score (STS), which analyzes a large basket of fundamental, internal, technical and sentiment data, issued a long-term sell signal in December 1999. Following the topping process in 2000, a prototypical secular bear market began that continues today.
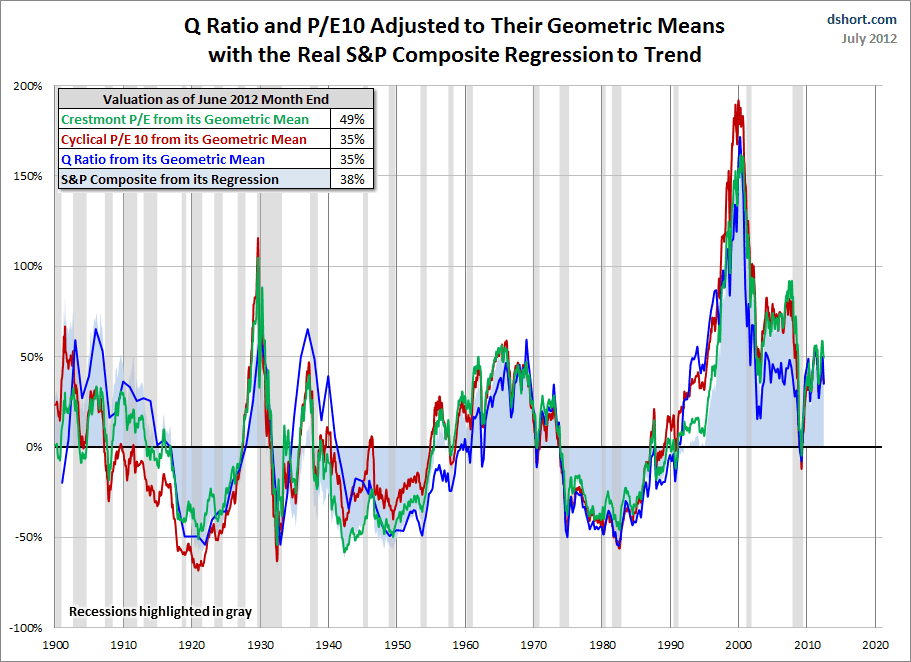
One way to gauge the development of stock market secular trends is through the analysis of valuations. Secular bull markets begin at low valuations with compressed multiples and end at richly valued levels, after which secular bears slowly grind valuations lower into the next secular bottom. There are many methods that can be used to calculate market valuations and the following graph from Doug Short displays the Crestmont Research P/E ratio, the cyclical P/E ratio using 10-year trailing earnings, the Q Ratio and the relationship between the S&P 500 index and a regression trend line.
The graph clearly displays the secular swings from undervalued levels to overvalued levels during the last 110 years. Note the extremely overvalued levels achieved before the crash in 1929 and during the internet bubble in the late 1990s. According to these measures, the S&P 500 index is currently 35 percent to 49 percent above the long-term valuation trend line. Additionally, stocks typically move 40 percent to 60 percent below that trend line before forming the next secular bottom. Therefore, this analysis suggests that valuations will move substantially lower before the upcoming secular low develops several years from now, agreeing closely with the current state of our STS.
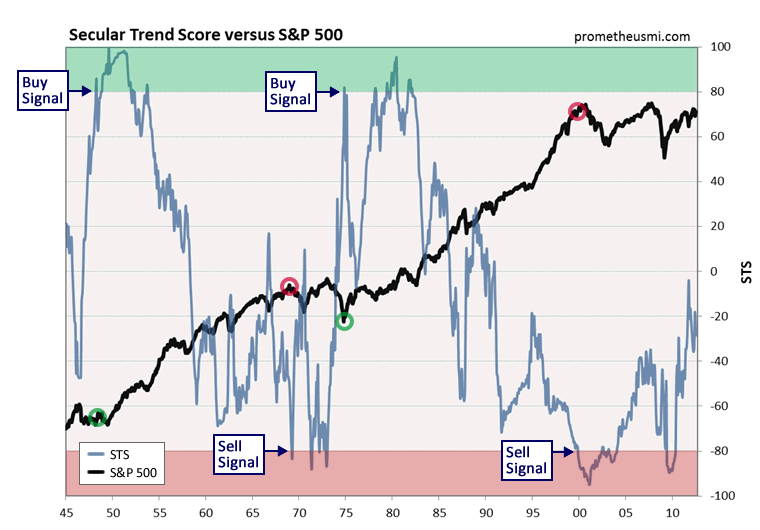
Following the generation of the last secular sell signal in 1999, the STS has remained in negative territory. The failure of the STS to return to positive territory during the last 12 years suggests that the current secular bear market remains in the middle stage of its development and forecasts several more years of poor investment performance heading into the next secular low. Secular inflection points form slowly, usually over the course of 6 to 12 months, so the STS will provide plenty of advance warning when the next true investment opportunity develops in the stock market.
- English (UK)
- English (India)
- English (Canada)
- English (Australia)
- English (South Africa)
- English (Philippines)
- English (Nigeria)
- Deutsch
- Español (España)
- Español (México)
- Français
- Italiano
- Nederlands
- Português (Portugal)
- Polski
- Português (Brasil)
- Русский
- Türkçe
- العربية
- Ελληνικά
- Svenska
- Suomi
- עברית
- 日本語
- 한국어
- 简体中文
- 繁體中文
- Bahasa Indonesia
- Bahasa Melayu
- ไทย
- Tiếng Việt
- हिंदी
Stock Market Secular Bottom Still Several Years Away
Published 07/05/2012, 02:09 AM
Updated 07/09/2023, 06:31 AM
Stock Market Secular Bottom Still Several Years Away
Latest comments
Install Our App
Risk Disclosure: Trading in financial instruments and/or cryptocurrencies involves high risks including the risk of losing some, or all, of your investment amount, and may not be suitable for all investors. Prices of cryptocurrencies are extremely volatile and may be affected by external factors such as financial, regulatory or political events. Trading on margin increases the financial risks.
Before deciding to trade in financial instrument or cryptocurrencies you should be fully informed of the risks and costs associated with trading the financial markets, carefully consider your investment objectives, level of experience, and risk appetite, and seek professional advice where needed.
Fusion Media would like to remind you that the data contained in this website is not necessarily real-time nor accurate. The data and prices on the website are not necessarily provided by any market or exchange, but may be provided by market makers, and so prices may not be accurate and may differ from the actual price at any given market, meaning prices are indicative and not appropriate for trading purposes. Fusion Media and any provider of the data contained in this website will not accept liability for any loss or damage as a result of your trading, or your reliance on the information contained within this website.
It is prohibited to use, store, reproduce, display, modify, transmit or distribute the data contained in this website without the explicit prior written permission of Fusion Media and/or the data provider. All intellectual property rights are reserved by the providers and/or the exchange providing the data contained in this website.
Fusion Media may be compensated by the advertisers that appear on the website, based on your interaction with the advertisements or advertisers.
© 2007-2024 - Fusion Media Limited. All Rights Reserved.
