It is difficult to gauge sentiment at the moment. Market sentiment is counter-intuitive but actually very logical. If there are too many bulls, the market can tilt in the other direction because most people have already done their buying. If there are too many bears, the market is oversold and prone to rally.
Right now, if you ask the bulls about sentiment, they say it's bearish, and if you ask the bears, they say it's bullish. It makes sense, since in both cases it justifies their own positions, but it's hard not to come away thinking it's a mixed bag. This is probably true, but we have enough information to look at that we can estimate on which side the ship is tilting.
We'll run through a few graphs, along with some observations and a short summary of where I think we stand. Please excuse the graphics, they are not my favorite format but I have not yet been able to adapt the information to the form I would like. I hope to be able to do so some time during the spring. For now, we'll make do.
Bloomberg is the source for all graphs except where indicated. As always, just click on the graph for a larger view.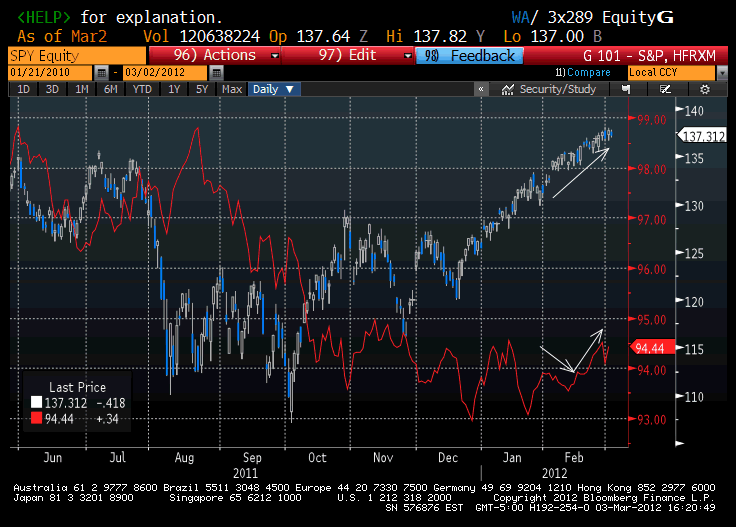
First up is an overlay of the S&P (blue and white candlesticks, as will be the case throughout), and the performance of the HFR Macro Index, HFRXM, in red. Watching the red line can give us some insights as to whether the managers in the index are long or short. If the line rises with the market, we can surmise they're long, and vice-versa. As we see, in early February they appeared to be short since they lost money as the market rose, but about 10 days into the month the two rose in tandem. We can assume they're long, meaning bullish.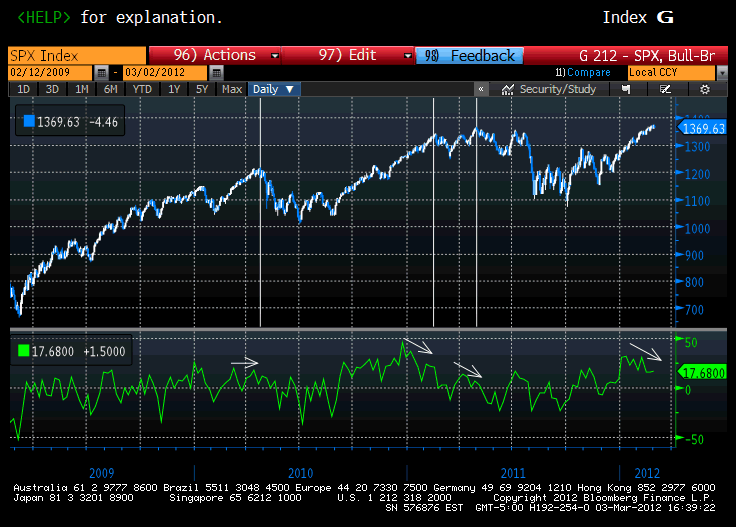
Next up is the AAII bull-bear indicator, indicated by the green line. The value of the line is determined by subtracting the number of bears from the number of bulls in AAII's weekly investor surveys. A high reading suggests a very bullish population, while a low reading points to a bearish mood. As you can see, people are in a relatively bullish mood, since bulls minus bears equals 17.68. Note that unlike market bottoms, market tops tend to occur after the bull-bear indicator has peaked and is headed down. At the moment the indicator is not inconsistent with a market top, though the reading is not conclusive.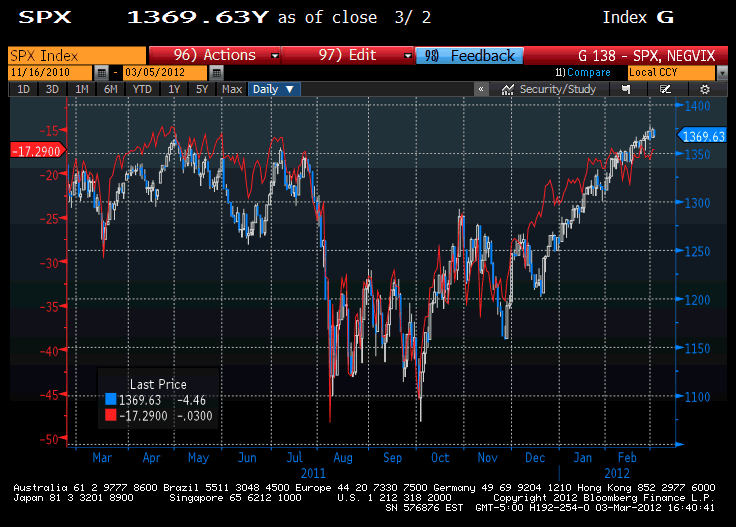
Next up we have the S&P 500 overlaid with the inverse of the VIX index, in red. The VIX index measures the implied volatility of stock index options, and is most simply thought of as the cost of insurance. If the VIX is high, investors are nervous, and vice-versa. Since we are looking at the inverse, a high value represents a period of low insurance premiums. As we can see, options are getting cheap. However, there is no major divergence between the two, so here too the result is not conclusive.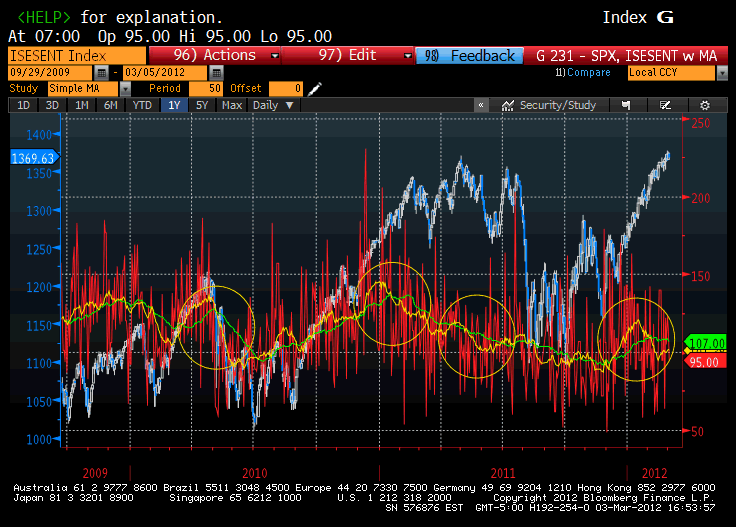
This noisy chart plots the ISEE sentiment index, a daily survey based on the ratio of open index puts and calls. If there are more puts, the market is deemed to be bearish, and vice-versa. The ISEE index is very noisy, so we have added two moving averages to filter the data, the 50-day moving average in green, and the 21-day moving average in yellow. We look for the yellow line to cross up above the green line, then move sharply below it, since this pattern coincides with market tops. As we can see, this is happening now.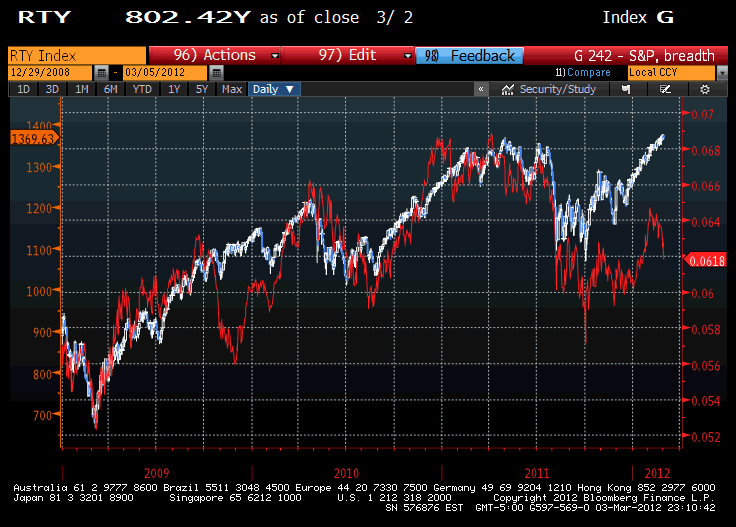
This chart shows the S&P overlaid with the ratio of the Russell 2000 to the Dow. As the red line rises, money is flowing into small cap stocks rather than blue chips. As the red line falls, the reverse is taking place. As we can see, recently the Dow Jones index is outperforming, resulting in the red line significantly diverging with the S&P. This has coincided with pullbacks in the past, though as we saw in 2009-2010, the two can separate for a long period of time. We can also see that recently the red line has hooked down in a sharp reversal.
Last up we have two contradictory sentiment indicators, though ostensibly they should be quite similar. First is the Crash Confidence Index, maintained by Yale University's business school.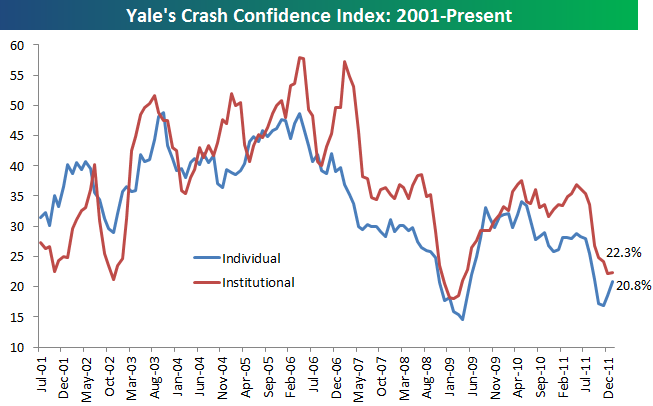
Bespoke Research has created the accompanying graph to illustrate Yale's results. The question posed of volunteers was how confident they were that we would not experience a stock market crash. As you can see, a relatively small number of respondents said they were confident a crash would not occur. In other words, respondents feared a crash, which we can interpret to be bearish.
However, now consider this: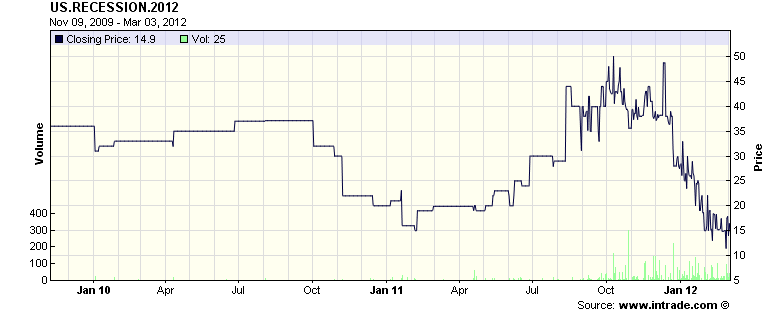
This chart represents the odds on offer at the betting site Intrade regarding the chances of a recession this year. As we see, that figure has been steadily dropping from about even odds back in October, to a very small 15% or so today. Bettors are clearly confident that the economy will avoid a recession this year. In other words, they're bullish.
What we're left with, by my read, is an overall bullish environment that is not inconsistent with a top. I say "not inconsistent" rather than "consistent" for a reason: Bullish markets can extend beyond the point that we could safely identify as "overbought." We could very well be topping out here, or we could continue up to make new highs. What does seem clear is that from a sentiment standpoint, we are closer to the beginning of the end than we are to the end of the beginning. Forewarned is forearmed. This is not the time for maximum equity exposure.
- English (UK)
- English (India)
- English (Canada)
- English (Australia)
- English (South Africa)
- English (Philippines)
- English (Nigeria)
- Deutsch
- Español (España)
- Español (México)
- Français
- Italiano
- Nederlands
- Português (Portugal)
- Polski
- Português (Brasil)
- Русский
- Türkçe
- العربية
- Ελληνικά
- Svenska
- Suomi
- עברית
- 日本語
- 한국어
- 简体中文
- 繁體中文
- Bahasa Indonesia
- Bahasa Melayu
- ไทย
- Tiếng Việt
- हिंदी
Stock Market Sentiment :Closer to Beginning of the End, Than to End of Beginning
Published 03/04/2012, 02:01 AM
Updated 07/09/2023, 06:31 AM
Stock Market Sentiment :Closer to Beginning of the End, Than to End of Beginning
Latest comments
Install Our App
Risk Disclosure: Trading in financial instruments and/or cryptocurrencies involves high risks including the risk of losing some, or all, of your investment amount, and may not be suitable for all investors. Prices of cryptocurrencies are extremely volatile and may be affected by external factors such as financial, regulatory or political events. Trading on margin increases the financial risks.
Before deciding to trade in financial instrument or cryptocurrencies you should be fully informed of the risks and costs associated with trading the financial markets, carefully consider your investment objectives, level of experience, and risk appetite, and seek professional advice where needed.
Fusion Media would like to remind you that the data contained in this website is not necessarily real-time nor accurate. The data and prices on the website are not necessarily provided by any market or exchange, but may be provided by market makers, and so prices may not be accurate and may differ from the actual price at any given market, meaning prices are indicative and not appropriate for trading purposes. Fusion Media and any provider of the data contained in this website will not accept liability for any loss or damage as a result of your trading, or your reliance on the information contained within this website.
It is prohibited to use, store, reproduce, display, modify, transmit or distribute the data contained in this website without the explicit prior written permission of Fusion Media and/or the data provider. All intellectual property rights are reserved by the providers and/or the exchange providing the data contained in this website.
Fusion Media may be compensated by the advertisers that appear on the website, based on your interaction with the advertisements or advertisers.
© 2007-2024 - Fusion Media Limited. All Rights Reserved.
