Returning to the unexciting and yet never-a-dull-moment sideways trend, it is advised, as has been noted before, by one of the defining texts on technical analysis named, aptly, Technical Analysis to sit on the sidelines of sideways trend trading and instead to wait for the break:
Trading within a range is difficult. Although many books suggest it as a strategy, it is almost impossible for the nonprofessional to profit through range trading. Thus, most traders stay away from trading within a trading range and instead wait for the inevitable breakout and beginning of a trend.
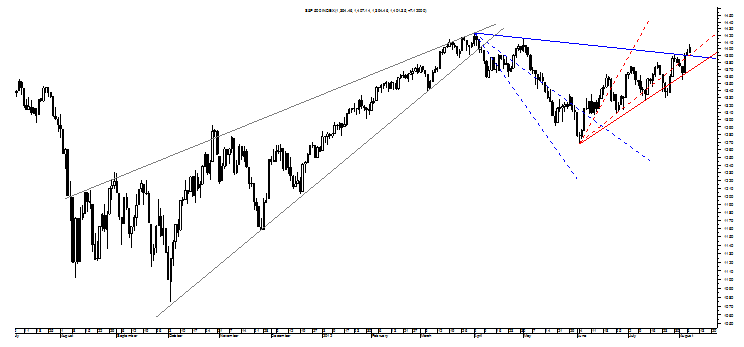
Relative to this year’s range on the S&P of 1267 to 1422, it is a rather wide range, and thus one that makes it more tempting than ever to try for its three major swipes up and down of about 10% and this seems particularly true of the move up off of the June lows.
Putting aside the fact that this two-month uptrend is comprised of 9 grinding whipsaws up or down of 5% or less for volatility that makes it unlikely that anyone but the inactive buy and hold investor captured the totality of the 11% move up, the technical “buy” signal within the sideways range – an early take on the directionless trading might break – did not come until Monday and a good reason to feel fine about avoiding temptation.

It is shown by the S&P’s busting above the top Bull Fan Line in blue and something that signals a reversal of the nearly five-month downtrend. What makes this buy signal problematic, however, is the pending sell signal created by the S&P’s hack-sawed trading of the last two months and something that would come if the S&P drops below the bottom Bear Fan Line in blue at about 1372 today and rising slightly each day thereafter.
When that potential sell signal is viewed in light of the S&P’s possible Spike Top from yesterday along with a new Bear Wedge and its multi-week Rising Wedge with a target of 1267 and its still-confirmed multi-month Rising Wedge with a target of 1075, it makes the recent buy signal less attractive and seems to reiterate why it may not be profitable for most people to trade the sideways range even when it is wide.
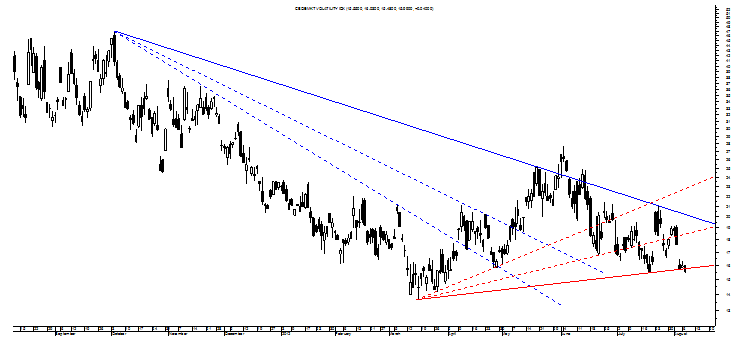
Supporting this view, unsurprisingly, is the VIX that is showing a set of near-term Bear Fan Lines in red and a set of intermediate-term Bull Fan Lines in blue. 
As can be seen, it was only yesterday that the VIX breached the third Bear Fan Line on an intraday basis while the very existence of the intermediate-term Bull Fan Lines gives cause to think the VIX will prove a reversal of its intermediate-term downtrend by climbing above the top trendline even though the timing of such a move is unclear outside of saying Q3 or early Q4. Supporting the VIX’s likely climb up is the gorgeous but unmarked Double Bottom above that carries a target of 41 and not so far from the unmarked Falling Wedge’s target of 48.
Relative to the very near-term in the VIX, it seems quite likely that a small Diamond Bottom may have put in a false initial reaction down considering that it was made on a gap at 17.56 that will fill and something that could put the focus on that pattern’s proper upside scenario with confirmation at 21 for a target of about 27. It is this decent possibility that puts the focus on the S&P’s Spike Top and yet another small Bear Wedge that will try to take the index back down to 1360 and a level that will negate the recent buy signal, validate the sell signal and come close to confirming the two-month Rising Wedge with a target of 1267.
Interestingly, the Dow Transports and Russell 2000 have not given any sort of buy signal as the Nasdaq Composite gives simultaneous buy and sell signals for a muddled mess that highlights why trading the range on intermediate-term lower highs in all of the equity indices is not advised for most.
Put another way, the S&P and VIX – among others – show why sideways means sidelines.
- English (UK)
- English (India)
- English (Canada)
- English (Australia)
- English (South Africa)
- English (Philippines)
- English (Nigeria)
- Deutsch
- Español (España)
- Español (México)
- Français
- Italiano
- Nederlands
- Português (Portugal)
- Polski
- Português (Brasil)
- Русский
- Türkçe
- العربية
- Ελληνικά
- Svenska
- Suomi
- עברית
- 日本語
- 한국어
- 简体中文
- 繁體中文
- Bahasa Indonesia
- Bahasa Melayu
- ไทย
- Tiếng Việt
- हिंदी
The S&P And VIX Show Why Sideways Means Sidelines
Published 08/08/2012, 07:31 AM
Updated 07/09/2023, 06:31 AM
The S&P And VIX Show Why Sideways Means Sidelines
3rd party Ad. Not an offer or recommendation by Investing.com. See disclosure here or
remove ads
.
Latest comments
Install Our App
Risk Disclosure: Trading in financial instruments and/or cryptocurrencies involves high risks including the risk of losing some, or all, of your investment amount, and may not be suitable for all investors. Prices of cryptocurrencies are extremely volatile and may be affected by external factors such as financial, regulatory or political events. Trading on margin increases the financial risks.
Before deciding to trade in financial instrument or cryptocurrencies you should be fully informed of the risks and costs associated with trading the financial markets, carefully consider your investment objectives, level of experience, and risk appetite, and seek professional advice where needed.
Fusion Media would like to remind you that the data contained in this website is not necessarily real-time nor accurate. The data and prices on the website are not necessarily provided by any market or exchange, but may be provided by market makers, and so prices may not be accurate and may differ from the actual price at any given market, meaning prices are indicative and not appropriate for trading purposes. Fusion Media and any provider of the data contained in this website will not accept liability for any loss or damage as a result of your trading, or your reliance on the information contained within this website.
It is prohibited to use, store, reproduce, display, modify, transmit or distribute the data contained in this website without the explicit prior written permission of Fusion Media and/or the data provider. All intellectual property rights are reserved by the providers and/or the exchange providing the data contained in this website.
Fusion Media may be compensated by the advertisers that appear on the website, based on your interaction with the advertisements or advertisers.
© 2007-2024 - Fusion Media Limited. All Rights Reserved.
