If you can remember market action for more than two months, you’re probably not wondering: “Is Market Volatility Gone for Good?” However you probably are wondering when this sustained upswing will be over. I’m keeping a close eye on things because I’ve had a run-up in my VelocityShares XIV holdings that I’d rather not lose to a correction.
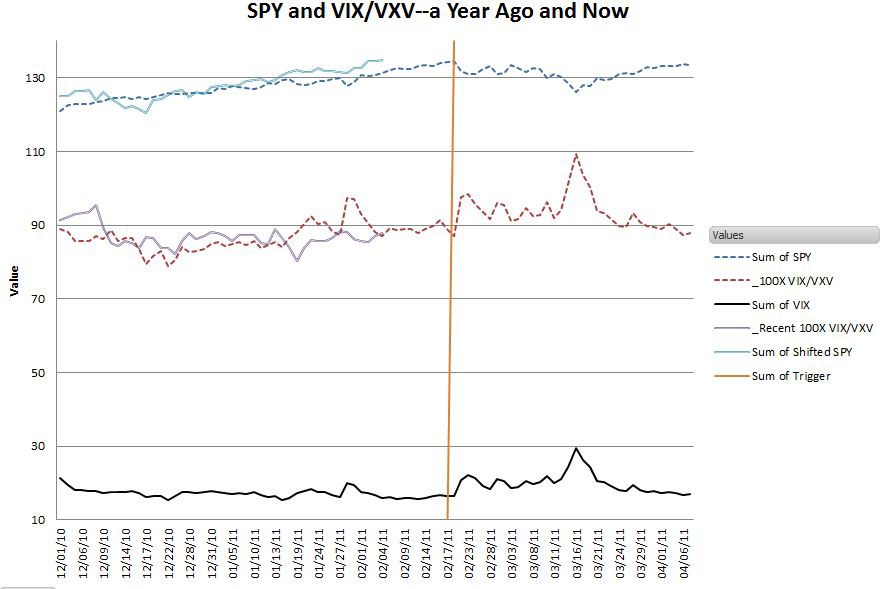
The last few months have felt like the market a year ago, when the market had a sustained climb. The chart below confirms that SPY is following a similar path—the dotted lines are last year’s data. The orange vertical line marks when the market shifted into a choppy sideways phase last year.
Predicting a market change is notoriously hard. Since it is driven by options premiums, and options traders are theoretically more sophisticated than standard equity investors you might expect the VIX index to move before the market—but it doesn’t. The chart below shows how the VIX bump (black line at bottom) lagged the the 18-Feb-2011 market shift by a couple of days.
SPY & Volatility, Now and a Year Ago
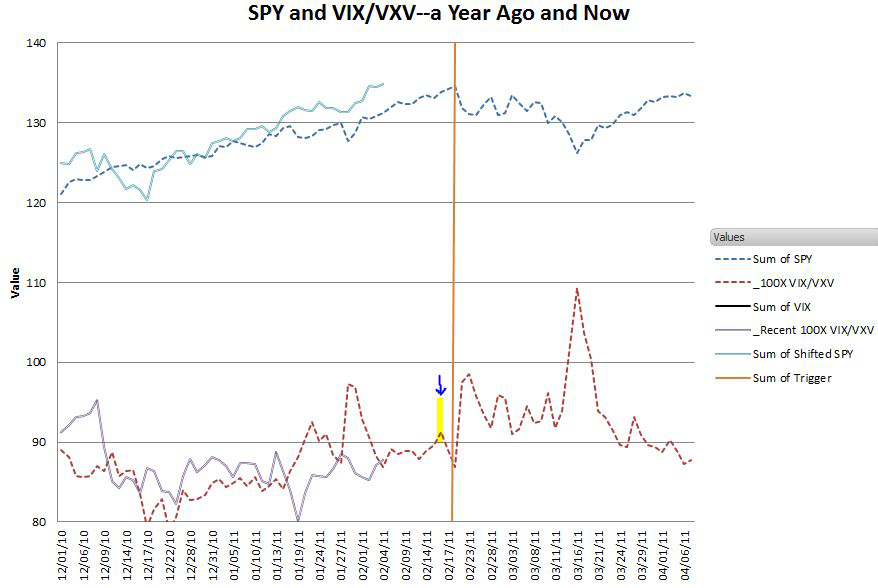
The trace around 90 shows the VIX/VXV ratio multiplied by 100. The VXV is a CBOE index similar to the VIX that projects volatility out 3 months instead of the VIX’s 1 month time frame. A magnified version of the chart is shown below:
A closer look at the VIX/VXV ratio
The VIX/VXV ratio shows an interesting little bump above 0.9 just a few days before the correction. The VIX index moved up slightly on those two days—it’s not readily apparent on the VIX chart, but the VXV didn’t move up as much, and as a result the ratio bumped up. The bright folks at Barclays use this VIX/VXV ratio as the master control for allocating volatility assets in their XVZ volatility ETN. When the ratio climbs to 0.90 or above they decrease their allocation into short volatility.
The chart shows that the VIX/VXV ratio rose above 0.9 several times in 2011 before the correction—false alarms.
However those bumps were accompanied by relatively big moves in the VIX index. It could be that the VIX/VXV ratio bumps that aren’t associated with significant overall jumps in volatility might be the signals to really watch.
I fully expect the VIX/VXV ratio to sound some false alarms in the future, but when it says the risk is low, with levels below 0.9, I’m inclined to relax.
The market closed yesterday with a VIX/VXV ratio of 0.878—I guess I’ll hold inverse volatility a bit longer.
- English (UK)
- English (India)
- English (Canada)
- English (Australia)
- English (South Africa)
- English (Philippines)
- English (Nigeria)
- Deutsch
- Español (España)
- Español (México)
- Français
- Italiano
- Nederlands
- Português (Portugal)
- Polski
- Português (Brasil)
- Русский
- Türkçe
- العربية
- Ελληνικά
- Svenska
- Suomi
- עברית
- 日本語
- 한국어
- 简体中文
- 繁體中文
- Bahasa Indonesia
- Bahasa Melayu
- ไทย
- Tiếng Việt
- हिंदी
When Will This Bull Run Be Over? Using the VIX/VXV Ratio as a Signal
Published 02/08/2012, 11:34 PM
Updated 07/09/2023, 06:31 AM
When Will This Bull Run Be Over? Using the VIX/VXV Ratio as a Signal
3rd party Ad. Not an offer or recommendation by Investing.com. See disclosure here or
remove ads
.
Latest comments
LONG S&P VIX @ 19.10 FEB12
Target at least 25!
Install Our App
Risk Disclosure: Trading in financial instruments and/or cryptocurrencies involves high risks including the risk of losing some, or all, of your investment amount, and may not be suitable for all investors. Prices of cryptocurrencies are extremely volatile and may be affected by external factors such as financial, regulatory or political events. Trading on margin increases the financial risks.
Before deciding to trade in financial instrument or cryptocurrencies you should be fully informed of the risks and costs associated with trading the financial markets, carefully consider your investment objectives, level of experience, and risk appetite, and seek professional advice where needed.
Fusion Media would like to remind you that the data contained in this website is not necessarily real-time nor accurate. The data and prices on the website are not necessarily provided by any market or exchange, but may be provided by market makers, and so prices may not be accurate and may differ from the actual price at any given market, meaning prices are indicative and not appropriate for trading purposes. Fusion Media and any provider of the data contained in this website will not accept liability for any loss or damage as a result of your trading, or your reliance on the information contained within this website.
It is prohibited to use, store, reproduce, display, modify, transmit or distribute the data contained in this website without the explicit prior written permission of Fusion Media and/or the data provider. All intellectual property rights are reserved by the providers and/or the exchange providing the data contained in this website.
Fusion Media may be compensated by the advertisers that appear on the website, based on your interaction with the advertisements or advertisers.
© 2007-2024 - Fusion Media Limited. All Rights Reserved.
