Sign up to create alerts for Instruments,
Economic Events and content by followed authors
Free Sign Up Already have an account? Sign In
Please try another search
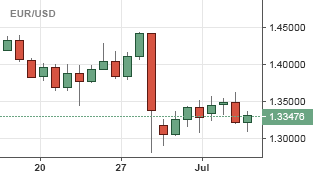
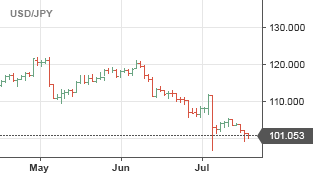
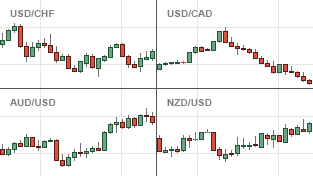
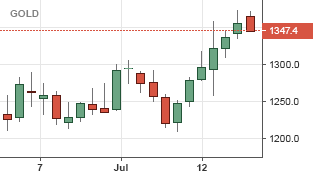
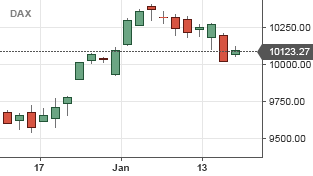
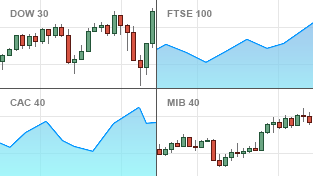
Investing.com’s real-time charting tool is a robust, technically advanced resource that is easy to use, so it’s intuitive enough for beginners but also powerful enough for advanced users. You can search for and select thousands of instruments via the input field – stocks, indices, commodities, currencies, ETFs, bonds, and financial futures.