This rare and very bearish pattern was all the rage last summer, but it seems to me that the real version of a possible 3 Peaks and Domed House pattern has been at play over the entire last two years of the S&P’s very volatile and wide sideways trading range.
Consider first a rendering of this pattern by my favorite pattern technician, Thomas Bulkowski, with the image below from his excellent and often-used-by-me web site – thepatternsite.com – and worth visiting by all.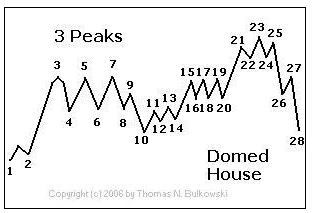
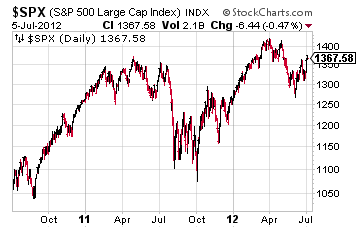
Next consider the unmarked 2-year daily chart of the S&P and there is clearly a strong resemblance to this pattern discovered by George Lindsey that brought him some distinction around corrections in the 1960s. According to Mr. Bulkowski, Mr. Lindsey provided several examples of this pattern at work including 1893 to 1895, 1910 to 1912, 1946 to 1948, 1964 to 1968 and then 1966 to 1969.
Looks like 2011 to 2012 may soon be on that list with the calls made by some well-known market players last year prescient even if too early with the 3 Peaks and Domed House that has been at play over the entirety of the last two years calling for a more than 20% fast decline in Q3 and/or Q4 of this year.
Let’s return to the chart of the S&P, though, to match it up the aforementioned points just to show how well this seemingly doomsday pattern, and something that makes me uncomfortable for both its message and sensationalism and something that is definitely ironic considering how much of my charting is devoted to bearish charts due to the very highly bearish nature of most charts, fits the last 24 months of highly volatile and directionless trading on the S&P.
For this, let’s look at the larger chart below with Mr. Bulkowski’s rendering below it. 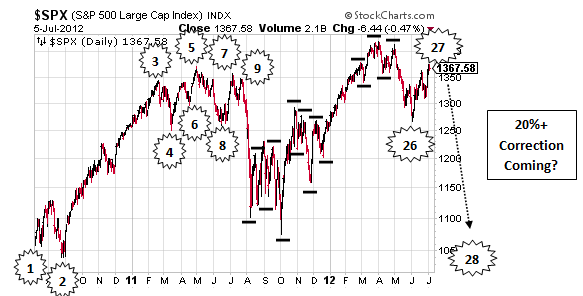
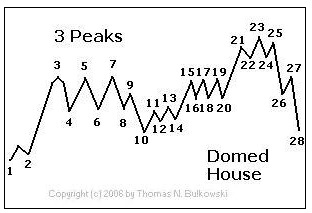
The comparison is not perfect with point 2 being a bit lower and points 10 through 20 slightly muddled relative to how Mr. Bulkowski has them drawn, but for a possible 28 point-pattern-to-be with the first 27 put in pretty well, it is quite clear that this may be the 3 Peaks and Domed House pattern for real and something worth noting considering that point 27 may be nearly completed.
Should the S&P’s current small Rising Wedge have put in an apex Friday or perhaps in the days to weeks ahead for a clear 27th point, its small Rising Wedge confirms at 1355 for a target of 1267 while its fulfilling larger Rising Wedge carries the precise objective of the 3 Peaks and Domed House at 1075. 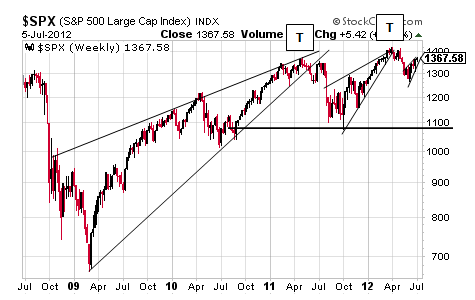
It is the potential success of these patterns that would be truly worrisome, though, because a close by the S&P below 1075 would serve to confirm a major Double Top with a target of 728 and close to the target of the S&P’s truly major Rising Wedge that stands out in the chart above.
Let’s take the one pattern at a time, though, and this means focusing on the highly complex 3 Peaks and Domed House that points down for the S&P.
- English (UK)
- English (India)
- English (Canada)
- English (Australia)
- English (South Africa)
- English (Philippines)
- English (Nigeria)
- Deutsch
- Español (España)
- Español (México)
- Français
- Italiano
- Nederlands
- Português (Portugal)
- Polski
- Português (Brasil)
- Русский
- Türkçe
- العربية
- Ελληνικά
- Svenska
- Suomi
- עברית
- 日本語
- 한국어
- 简体中文
- 繁體中文
- Bahasa Indonesia
- Bahasa Melayu
- ไทย
- Tiếng Việt
- हिंदी
3 Peaks And Domed House Point Down For The S&P 500
Published 07/08/2012, 12:36 AM
Updated 07/09/2023, 06:31 AM
3 Peaks And Domed House Point Down For The S&P 500
3rd party Ad. Not an offer or recommendation by Investing.com. See disclosure here or
remove ads
.
Latest comments
Nice discovery and comparison. The really mind boggling part is how George Lindsay formulated a pattern as complex as 3 peaks and domed house in the first place. Once it's put out there, we have to admit certain degree of self-fulfilling prophecy at play.
Very nice analysis. 3 digits S&P HERE WE COME!!!
Well done. You should run for President.
Install Our App
Risk Disclosure: Trading in financial instruments and/or cryptocurrencies involves high risks including the risk of losing some, or all, of your investment amount, and may not be suitable for all investors. Prices of cryptocurrencies are extremely volatile and may be affected by external factors such as financial, regulatory or political events. Trading on margin increases the financial risks.
Before deciding to trade in financial instrument or cryptocurrencies you should be fully informed of the risks and costs associated with trading the financial markets, carefully consider your investment objectives, level of experience, and risk appetite, and seek professional advice where needed.
Fusion Media would like to remind you that the data contained in this website is not necessarily real-time nor accurate. The data and prices on the website are not necessarily provided by any market or exchange, but may be provided by market makers, and so prices may not be accurate and may differ from the actual price at any given market, meaning prices are indicative and not appropriate for trading purposes. Fusion Media and any provider of the data contained in this website will not accept liability for any loss or damage as a result of your trading, or your reliance on the information contained within this website.
It is prohibited to use, store, reproduce, display, modify, transmit or distribute the data contained in this website without the explicit prior written permission of Fusion Media and/or the data provider. All intellectual property rights are reserved by the providers and/or the exchange providing the data contained in this website.
Fusion Media may be compensated by the advertisers that appear on the website, based on your interaction with the advertisements or advertisers.
© 2007-2024 - Fusion Media Limited. All Rights Reserved.
