
Market Overview: S&P 500 E-mini Futures
The S&P 500 E-mini futures traded a sideways to up pullback from a higher low major trend reversal. Bulls need to create a consecutive bull bar (follow-through buying) next week, something they have failed to do since March. The bear trend line and 20-week exponential moving average remain resistances above. If next week closes as a bear bar instead, it will mean the bulls failed to get follow-through buying yet again. Odds of a re-test of June low increases.
S&P500 E-mini futures
The Weekly S&P 500 E-mini chart

- This week’s E-mini candlestick was a bull bar with a prominent tail above and a long tail below. It closed above the middle of the bar.
- Last week, we said that odds slightly favor sideways to up and a test of the bear trend line, and after that, near the June 2 high.
- This week, the E-mini broke above the bear trend line and closed above the June 28 high.
- Bulls want a reversal higher from a trend channel line overshoot, and a wedge bottom (Feb 24, May 20 and June 17).
- They want a continuation higher from a higher low major trend reversal. The next targets for the bulls are the 20-week exponential moving average and the June 2 high.
- Bulls see this week as the second leg sideways to up pullback which started from June low.
- Bulls need to create a consecutive bull bar (follow-through buying) next week, something they have failed to do since March.
- Bears want the E-mini to stall at the bear trend line, or the 20-week exponential moving average, or around the June 2 high. They want a reversal lower from a lower high.
- They then want a breakout below the June low and a continuation of the measured move down to 3600 or lower around 3450, based on the height of the 12-month trading range starting from May 2021.
- This week closed above the middle of the bar but had a prominent tail above. The bulls are not as strong as they could have been. It is an average buy signal bar for next week.
- In the last 5 weeks, the bears are not getting consecutive bear bars (follow-through selling) like those from April to June. The bear bars have prominent tails below and the bull bars have closes near the highs or above the middle of the bar.
- For now, odds slightly favor sideways to up for next week.
- Traders will see whether the bulls get follow-through buying next week. If they get that, the odds of testing the June 2 high increases.
- If next week closes as a bear bar instead, it will mean the bulls failed to get follow-through buying yet again. Odds of a re-test of June low increases.
- The Daily S&P 500 E-mini chart
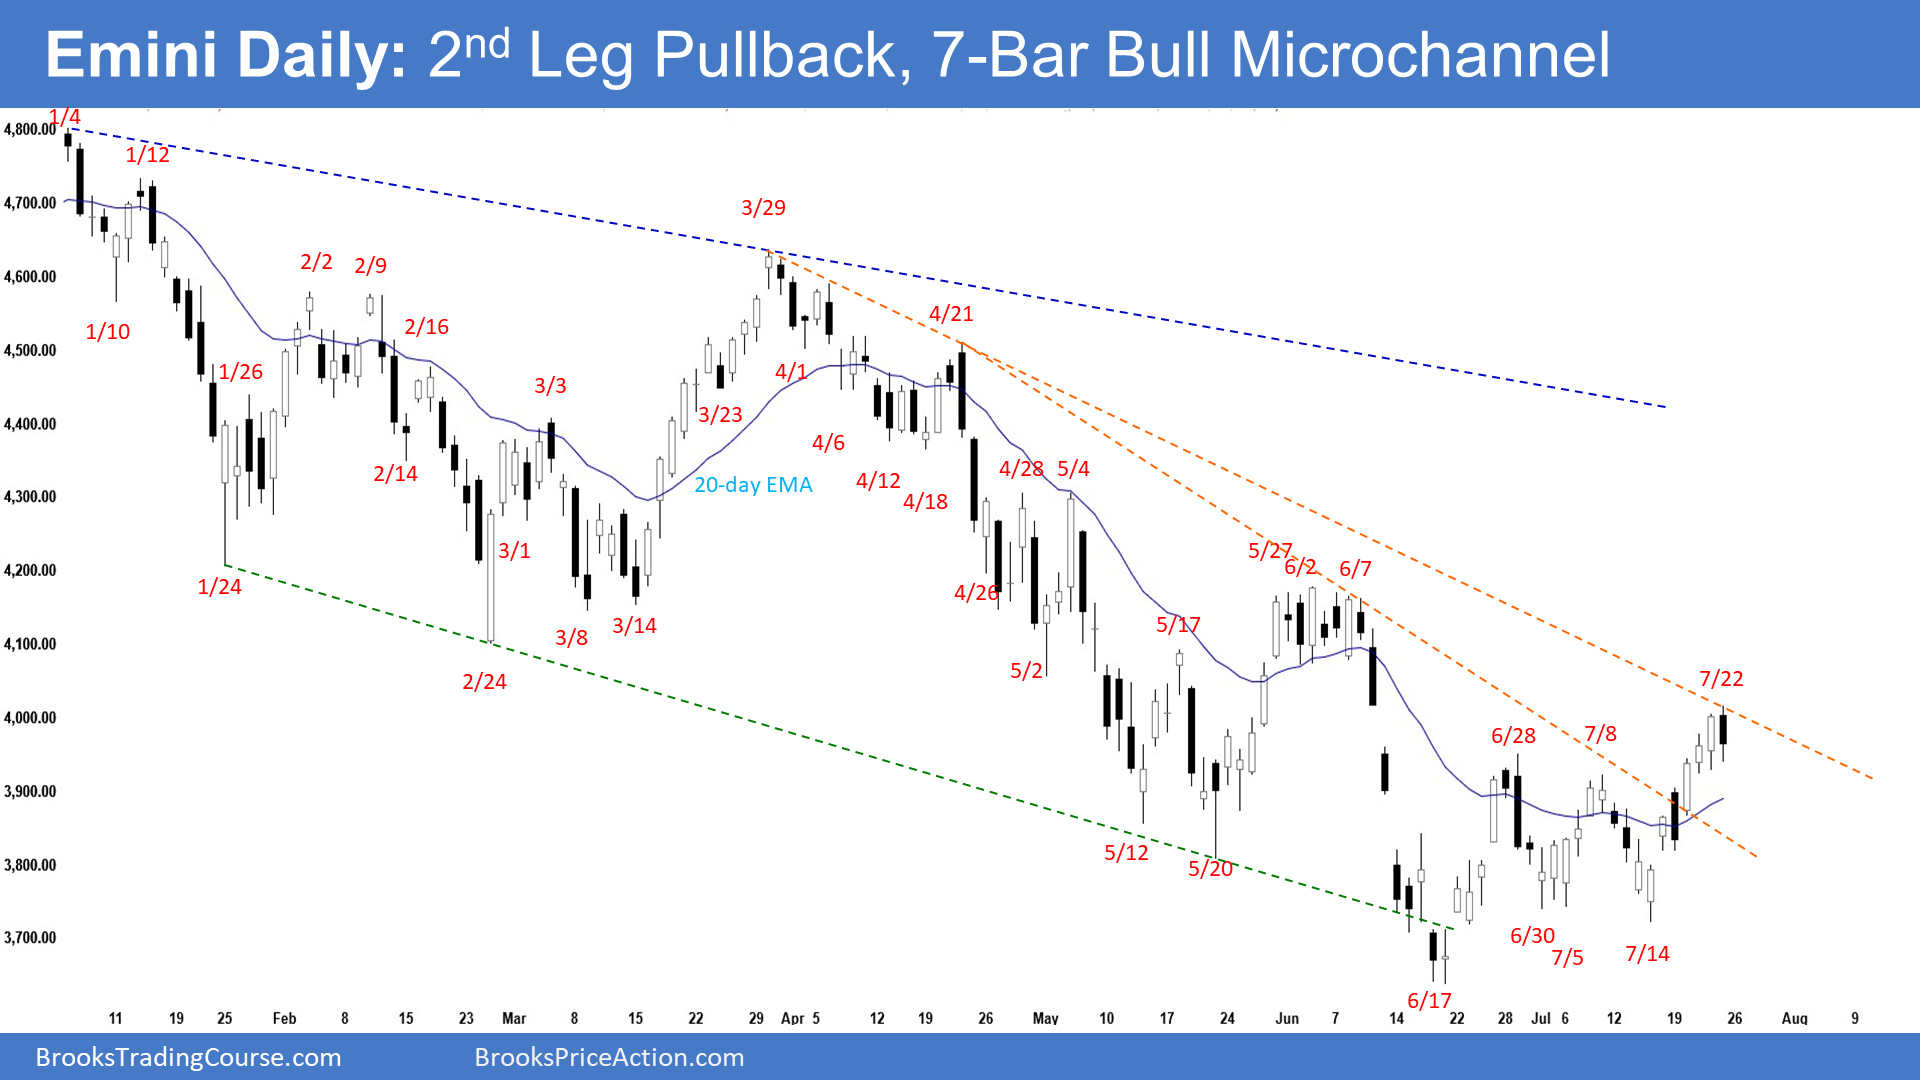
- The E-mini gapped higher on Monday but reversed to close as a bear bar. Tuesday gapped higher and bulls got follow-through buying trading above June 28 high. Friday traded higher but reversed to close as a bear bar with a tail below.
- Last week, we said that odds slightly favor sideways to up. The bulls will need to break the resistances above (bear trend line & 20-day exponential moving average) with consecutive bull bars closing near their highs.
- This week, the E-mini rallied from a double bottom higher low major trend reversal. The E-mini broke above the bear trend line and the June 28 high.
- Bulls want a failed breakout below the May low.
- They want a reversal higher from a trend channel line overshoot and a wedge bottom (Feb 24, May 20 and June 17).
- The move up since July 14 is in a tight bull channel. There is a 7-bar bull micro channel. It increases the odds of at least a small second leg sideways to up.
- Bears want a reversal lower from a double top bear flag (June 2 and July 22).
- They then want a break below the June low followed by a continuation of the measured move down to around 3600 based on the height of the 9-month trading range or lower, around 3450 based on the height of the 12-month trading range starting with May 2021.
- They hope the current pullback will stall at the next bear trend line and form a lower high below the June 2 high.
- Since Friday was a bear bar with a prominent tail below, it is a sell signal bar for Monday. However, it followed a 7-bar bull micro channel. It is not a strong sell setup.
- Odds are the first small pullback would be bought.
- If the bears get a few strong consecutive bear bars early next week (follow-through selling) instead, odds of a re-test of June low increases.
- It would likely mean the end of the two-legged sideways to up pullback which began from June 17 low.
- We have said that the bulls will need to break through the resistances above to test June 2 major lower high soon or the bears will return for a retest of the June low within 1 to 3 weeks. This remains true.
- For now, odds slightly favor sideways to up. Traders will see if the bulls get sustained follow-through buying, something they have failed to do since March.