Yesterday, Chris Devauld from the Prospecting Journal wrote a readworthy article („Goals Met, New Targets Set: Endeavour Mining Earns an A+ For 2011 Results“) on Endeavour Mining Corp. (TSX: EDV; market cap.: $563 million).
In the article, it was noted that the 2 West-African mines, Youga and Nzema, produced around 177,000 oz gold in 2011 generating an operating cash-flow of $91 million. The mill grade from the Nzema deposit in Ghana, which produced 90,026 oz, averaged 1.7 g/t gold with cash-costs of $585/oz, whereas the Youga deposit in Burkina Faso averaged a mill grade of 3.1 g/t gold with cash-costs of $644/oz.
It was highlighted that both mines are set to increase their production in 2012 and beyond – also thanks to ongoing aggressive exploration programs that are continueing to increase both resources. For 2012, the company has budgeted $19 million for the exploration of Youga and Nzema, whereas an additional $11 million is directed towards the exploration of its other deposits in Côte d’Ivoire ($8 million), Mali ($2 million) and Liberia ($1 million). Around 80% of this $30 million budget is dedicated for near-mine projects and the remaining 20% for regional exploration. In total, more than 200,000 m of drilling is planned for 2012 alone.
In 2010, some 82,400 oz were produced generating a cash-flow of $36 million. At a gold price of $1,600/oz, the 2012 cash-flow is forecasted to be increased by around 50% from the $91 million of 2011. This remarkable increase comes solely from the Youga and Nzema mines. The completion of the Agbaou mine in Côte d’Ivoire is expected to produce around 100,000 oz per year generating additional cash-flows of around $160 million per year at a gold price of $1,600.
Based on these prospective fundamentals, we value the company as undervalued considering its current market valuation of solely $563 million and its stock having traded 4-times higher some 4 years ago.
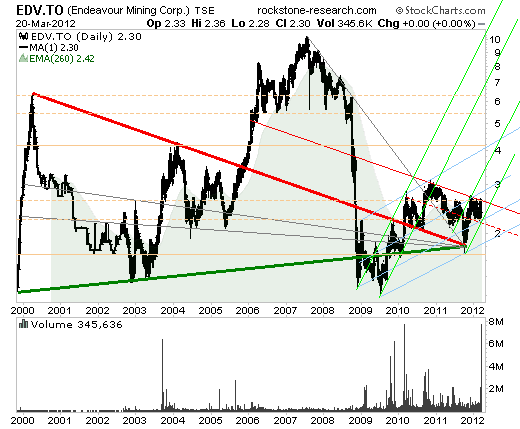
Technically, the stock fluctuated within the red-green triangle between 1999-2005, whereafter the resistive red leg was broken at approx. $3.50. The subsequent “breakout” went to around $10 in 2007, whereafter the so-called “classical pullback” started bringing the price back into the triangle in 2008-2010. Because this pullback breached the lower green triangle leg numerous times, the price undertook numerous breakouts and pullbacks in 2010-2011 – in order to finally confirm the (formerly resistive) red leg as new support.
In late 2011, the apex of the red-green triangle was reached, whereafter the final movement of a triangular price formation typically starts: the so-called “thrust” – either a strong and longer-termed up- or downward trend. As the price started to rise after having hit the apex, we anticipate the thrust to go to the upside. We expect a strong acceleration of price increase once the uppermost red trendline at approx. $2.70 is broken. In general, the goal of a thrust is to rise above the high of the triangle (approx. $6.50) and its breakout (approx. $10) and to transform these former resistances into new support – in order for a new and longer-termed upward-trend to commence thereafter. 
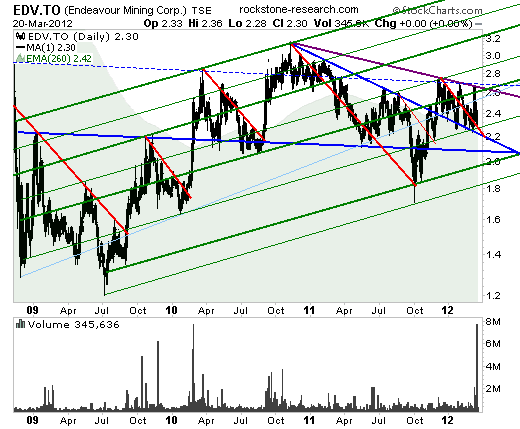
Putting the stock-price development since late 2008 into perspective, it strikes the eye that a (blue) triangle started to form in mid-2010, whereas strong price increases („thrusts“) were achieved predominately after having broken the red (parallel) resistances.
In terms of the larger-scaled blue triangle, a breakout above the upper leg was accomplished in late 2011, whereafter numerous pullbacks successfully tested and confirmed the (formerly resistive) blue leg as new support. Recently, the red resistance was broken resulting in our anticipation that a thrust to the upside is near-by.
The thrust to the upside is expected to accelerate sharply once the violet and blue-dashed resistances currently at approx. $2.70 are broken and transformed into new support.
According to this chart, a sell-signal is not given until breaching the lower blue leg currently at approx. $2.10 and the lowermost green supports at approx. $2 and $1.80 – as only thereafter a thrust to the downside must be taken into account as a risk. 
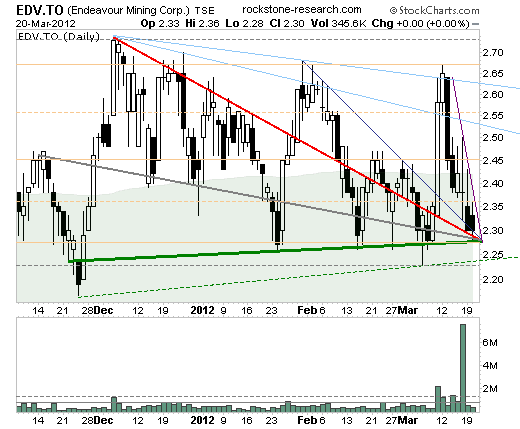
Looking at the stock-price since late 2011, a red-gray-green triangle can be noticed having developped and that the price tried numerous breakouts starting in late January.
Yet it was only some 8 trading days ago, when the price conducted a clear breakout from $2.33 to $2.68, whereafter the pullback brought the stock back to the triangle apex at approx. $2.28.
As having reached the apex Tuesday, a thrust is anticipated to start any time now.
Thus, a strong buy-signal à la thrust to the upside is generated when rising above the violet resistance currently at approx. $2.33. 
Disclaimer: Please read the full disclaimer at www.rockstone-research.com as the above article is not be construed as an investment advise, consultation or recommendation to buy, sell or even hold the stock or any other securities or interests of the above mentioned company. The author did not receive any money or other kinds of tangible or intangible incentives from the above mentioned company or any one else to write the article. However, the author holds stock of the company and is therefore biased.
- English (UK)
- English (India)
- English (Canada)
- English (Australia)
- English (South Africa)
- English (Philippines)
- English (Nigeria)
- Deutsch
- Español (España)
- Español (México)
- Français
- Italiano
- Nederlands
- Português (Portugal)
- Polski
- Português (Brasil)
- Русский
- Türkçe
- العربية
- Ελληνικά
- Svenska
- Suomi
- עברית
- 日本語
- 한국어
- 简体中文
- 繁體中文
- Bahasa Indonesia
- Bahasa Melayu
- ไทย
- Tiếng Việt
- हिंदी
Endeavour Mining: Undervalued With 3 Mines And 3 Triangles
Published 03/22/2012, 12:58 AM
Updated 07/09/2023, 06:31 AM
Endeavour Mining: Undervalued With 3 Mines And 3 Triangles
3rd party Ad. Not an offer or recommendation by Investing.com. See disclosure here or
remove ads
.
Latest comments
Install Our App
Risk Disclosure: Trading in financial instruments and/or cryptocurrencies involves high risks including the risk of losing some, or all, of your investment amount, and may not be suitable for all investors. Prices of cryptocurrencies are extremely volatile and may be affected by external factors such as financial, regulatory or political events. Trading on margin increases the financial risks.
Before deciding to trade in financial instrument or cryptocurrencies you should be fully informed of the risks and costs associated with trading the financial markets, carefully consider your investment objectives, level of experience, and risk appetite, and seek professional advice where needed.
Fusion Media would like to remind you that the data contained in this website is not necessarily real-time nor accurate. The data and prices on the website are not necessarily provided by any market or exchange, but may be provided by market makers, and so prices may not be accurate and may differ from the actual price at any given market, meaning prices are indicative and not appropriate for trading purposes. Fusion Media and any provider of the data contained in this website will not accept liability for any loss or damage as a result of your trading, or your reliance on the information contained within this website.
It is prohibited to use, store, reproduce, display, modify, transmit or distribute the data contained in this website without the explicit prior written permission of Fusion Media and/or the data provider. All intellectual property rights are reserved by the providers and/or the exchange providing the data contained in this website.
Fusion Media may be compensated by the advertisers that appear on the website, based on your interaction with the advertisements or advertisers.
© 2007-2024 - Fusion Media Limited. All Rights Reserved.
