Some investors believe that gold is the “real” money (and some believe that is nonsense). Some of those who believe it is real money express that belief in terms of currency debasement through an ever expanding quantity of currency in circulation.
Their argument is that the wealth of a nation at any moment is a fixed value, and that by merely printing more fiat currency (paper money declared by government to be legal tender with no asset backing required), the currency is worth less and less and gold worth more and more — Weimar Republic hyperinflation and Zimbabwe hyperinflation being the extremes of that.
Historical Narrative Perspective:
In 1900 the U.S. Dollar became convertible and redeemable into gold for any holder, both citizens and foreign governments. During 1933, the Dollar was made convertible into gold only by foreign governments, not U.S. citizens. In 1971, the U.S. Dollar was made not convertible into gold by any party.
Here is how it is explained by the Richmond Federal Reserve Bank.
“March 14, 1900 – The Gold Standard Act officially placed the United States on the gold standard…. H.J. Res. 192, approved by President Roosevelt on June 5, 1933, provided that obligations payable in gold or specific coin or currency are contrary to public policy, and that those obligations could be discharged dollar for dollar in legal tender. After that resolution was adopted, currency of the United States could not be converted into gold by United States citizens, but the Treasury would convert dollars into gold for foreign governments as a means of maintaining stability and confidence in the dollar. Because the dollar was no longer freely convertible, one could consider that the United States was no longer on the gold standard at that time. If, however, one considers the gold standard as a monetary system in which the unit of money is backed by gold even if the monetary unit cannot be converted into gold, one could argue that the United States went off of the gold standard on August 15, 1971 when President Nixon announced that the U.S. dollar would no longer be convertible into gold in the international markets. The President was able to suspend the ability to convert the dollar into gold because there was no legal requirement that the United States exchange gold for dollars.
… when the United States stopped selling gold to foreign official holders of dollars at the rate of $35 an ounce in 1971, it brought the gold exchange standard to an end. In 1973, the United States officially ended its adherence to the gold standard. Many other industrialized nations also switched from a system of fixed exchange rates to a system of floating rates. In August 1974, President Ford repealed the prohibition on the public’s owning gold or engaging in gold transactions. Today, no country bans private ownership of gold.”
Prior to 1968, the U.S. was committed to maintain 25% gold reserves versus the conversion privileges of the paper currency. There is no such requirement today.
Beginning and Ending Data:
According to the US Treasury’s “US International Reserve Position” the 10/12/2012 US gold hoard is 261,497,506 ounces. According to the Federal Reserve Bank, the September 1, 2012 quantity of U.S. currency in circulation is $1.064 Trillion. The price of gold on September 1 was $1,692. The ratio of currency in circulation per ounce of gold held by the U.S. based on this data was $4,079 (let’s term that the “conversion ratio”). We should point out that the European Union has nearly the same conversion ratio. Japan, however, has a much higher conversion ratio (indicating a greater currency debasement on their part than in the U.S. and in Europe).
For contrast, they reported the a July 199 gold holdings slightly greater than now at 261,615,927 ounces, and a quantity of currency in circulation of $0.488 Trillion. The price of gold back then was $258 per ounce. The conversion ratio then was $1,864.
Currency In Circulation Changes:
From 1969 through now, the average annual rate of change of currency in circulation was 6.98%. Figure 1 shows that data, with more significant variation since about 1990. Figure 2 presents the same data for the shorter period from 2000, since which the average annual currency expansion has been 6.28%
Figure 1: Long-Term Rate of Change Of USD In Circulation 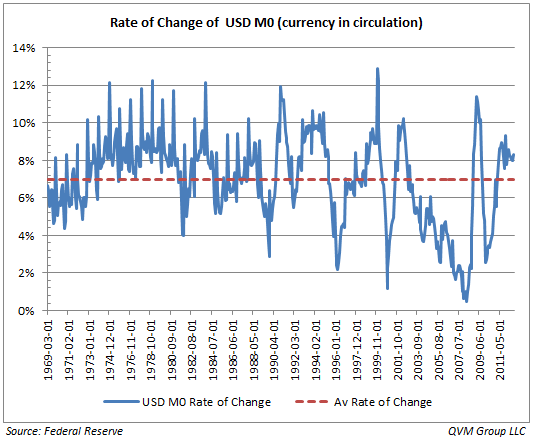
Figure 2: Intermediate-Term Rate of Change of USD In Circulation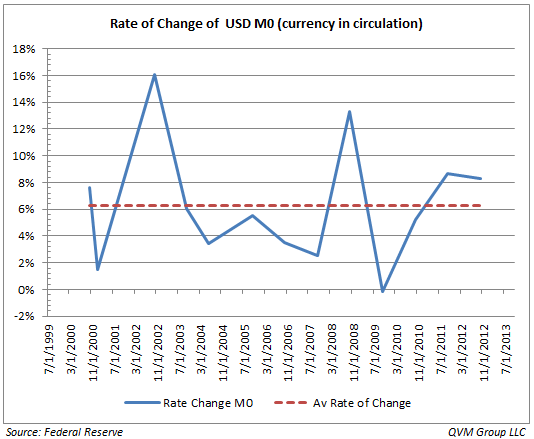
Indexed Currency In Circulation vs. Indexed Gold Price:
Starting in July 1999, we indexed the amount of currency in circulation and the price of gold to see what that might reveal. The gold price really took off after 2003 (which happened to be the bottom in the stock market).
Figure 3: Indexed Change in M0 (M Zero) vs Indexed Gold Price
M0 (M zero) is the letter designation for total currency in circulation.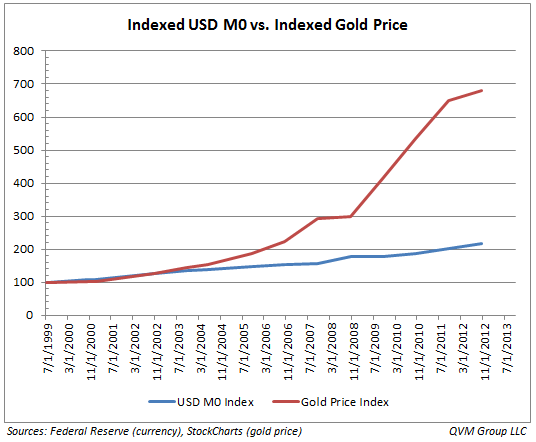
Gold Price vs. Conversion Ratio:
The price of gold and the conversion ratio seem to move in parallel as shown in Figure 4, but by starting at different base levels had quite different growth patterns (as shown in Figure 3).
Figure 5 shows the spread between the price of gold and the conversion ratio. Interestingly, the spread has been roughly steady with an average spread of $2,221. The spread went above the average in 2008 when gold declined 30%, and above the average when gold surged during the stock market recovery, now is closer to average. If the average persists, the current price of gold might be expected to be about $1,860.
Figure 4: Actual Gold Price vs USD Currency/Treasury Gold Holdings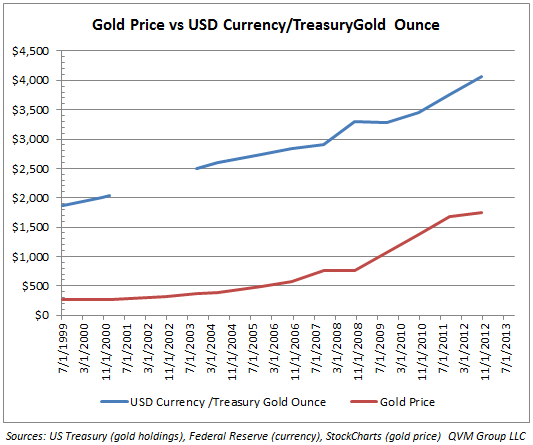
Figure 5: Gold Price and Conversion Ratio Spread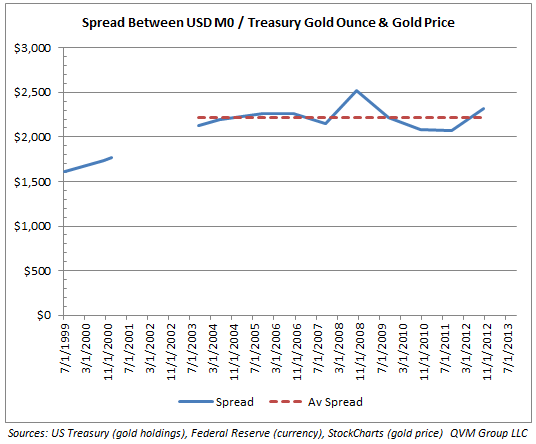
According to the “gold is real money” advocates, there should be some kind of long-term relationship between the price of gold and the conversion ratio [ remember, the conversion ratio shows the price of Treasury gold per ounce that under a hypothetical full conversion regime would result in no outstanding fiat currency and no gold in the Treasury ]. From that perspective, how then could the gold price vary so much versus the conversion ratio from 1999 to now, given there was plenty of time between 1971 and 1999 for the gold market price to adjust to the fiat currency world regime?
If the real money theory holds water (and it may or may not be adequate as a single variable to explain gold price movement over the long-term), the likely explanation would be that ebbing and flowing of investor interest and trust in the stock market and government, and fears of deflation or inflation, and exchange rates the put the Dollar higher and lower at times; all added layers of upward and downward pressure on gold, causing it to fluctuate around a more central value based on the concept of gold being real money that in the end would be based on how much gold was potentially behind it.
Other Factors Potentially Better Related To Gold Price:
We think there should be some metric or some set of metrics that can be tracked to help establish when gold is overvalued or undervalued. Fiat currency per ounce of central bank gold is the most logical fist suspect since that is actually the way it was under the legal system as one time in the past.
There may be others, and we are looking for them. Our prior blog post did an historical chart review of the relationship between the price of gold and several other assets and did not find any essentially better metric. That doesn’t make the conversion ratio a good or the best metric, but it doesn’t knock it out of consideration either.
Perhaps there is a polynomial metric that we will find with further research, but pending that we are inclined to think that, all other things being constant (which they seldom are), gold is likely to find a current center around $1,860, advance at least 6% per year as the currency base appears likely to do, and perhaps break with its multi-year spread behavior and approach $4,000 per ounce to reach the conversion ratio. Then again it could drop into bear market territory under recession/deflation conditions.
As time goes by and the likely 6% currency expansion continues, the $1,860 center and the $4,000 price potential would probably increase proportionately.
Gold could, of course go well beyond the currency growth adjusted $4,000, but the rationale would need to be established to understand it or manage around it (e.g a collapse in the exchange rate of the Dollar, which is the global price base of gold; or currency printing presses gone crazy).
Temporary Gold Price Decline Scenario:
As we have noted in other posts, there is also a realistic chance of gold at least temporarily declining to something like $1,300 if it goes down 30% from its recent peak, as it did in the 2008 market crash. That possibility arises because (a) gold is in a decline at the moment, and (b) the fiscal cliff has the potential to be market disrupting and deflation fear generating as was the case in 2008.
Figure 6: Current Daily Chart For GLD (gold ETF) for 1 Year:
The leading physical gold fund is GLD. For who do not own bullion directly or do not traded in gold futures, this fund is a popular alternative. Other physical gold ETFs are IAU, SGOL and AGOL, but GLD is the largest and most liquid, with liquid stock options available.
The dashed gold line is the 200-day average. The pink shaded area is the 3-month price channel. The green shaded area is the 1-month price channel.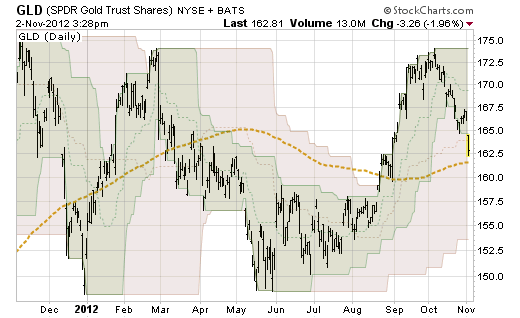
Figure 7: Weekly GLD Prices Since Inception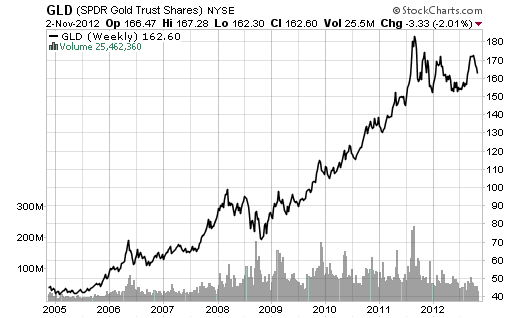
Figure 8: Daily Price Ratio of GLD to Gold
The ratio of the prices of GLD and gold are not constant, although GLD trades in the vicinity of 1/10th the price of gold. The daily fluctuations in the ratio, represent the inefficiencies in the arbitrage process that is intended to keep the price and the NAV close. The gradual decline in the ratio probably represents the drag effect of fund expenses.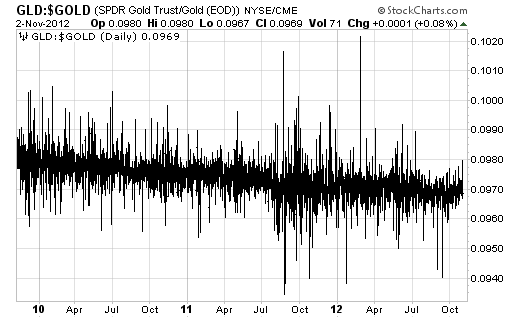
Figure 9: GLD and GOLD Plotted Side-by-Side:
The price ratio might give a more severe interpretation of the price relationship than this chart, which plots GLD and gold prices on the same chart. The gold price scale is on the left, and the GLD price scale is on the right. The plots are minimally different and virtually on top of each other.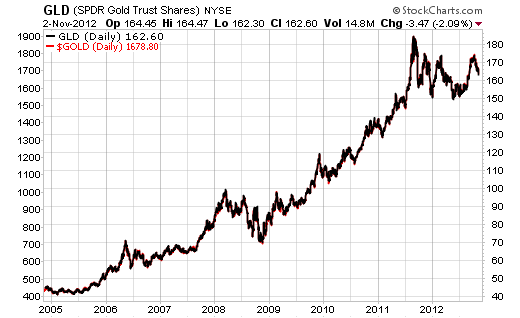
Disclosure: We have positions in GLD and positions in Puts and Calls relating to GLD.
- English (UK)
- English (India)
- English (Canada)
- English (Australia)
- English (South Africa)
- English (Philippines)
- English (Nigeria)
- Deutsch
- Español (España)
- Español (México)
- Français
- Italiano
- Nederlands
- Português (Portugal)
- Polski
- Português (Brasil)
- Русский
- Türkçe
- العربية
- Ελληνικά
- Svenska
- Suomi
- עברית
- 日本語
- 한국어
- 简体中文
- 繁體中文
- Bahasa Indonesia
- Bahasa Melayu
- ไทย
- Tiếng Việt
- हिंदी
Exploring Relationship: Currency In Circulation, Treasury Gold Holdings
Published 11/05/2012, 01:02 AM
Updated 07/09/2023, 06:31 AM
Exploring Relationship: Currency In Circulation, Treasury Gold Holdings
3rd party Ad. Not an offer or recommendation by Investing.com. See disclosure here or
remove ads
.
Latest comments
Install Our App
Risk Disclosure: Trading in financial instruments and/or cryptocurrencies involves high risks including the risk of losing some, or all, of your investment amount, and may not be suitable for all investors. Prices of cryptocurrencies are extremely volatile and may be affected by external factors such as financial, regulatory or political events. Trading on margin increases the financial risks.
Before deciding to trade in financial instrument or cryptocurrencies you should be fully informed of the risks and costs associated with trading the financial markets, carefully consider your investment objectives, level of experience, and risk appetite, and seek professional advice where needed.
Fusion Media would like to remind you that the data contained in this website is not necessarily real-time nor accurate. The data and prices on the website are not necessarily provided by any market or exchange, but may be provided by market makers, and so prices may not be accurate and may differ from the actual price at any given market, meaning prices are indicative and not appropriate for trading purposes. Fusion Media and any provider of the data contained in this website will not accept liability for any loss or damage as a result of your trading, or your reliance on the information contained within this website.
It is prohibited to use, store, reproduce, display, modify, transmit or distribute the data contained in this website without the explicit prior written permission of Fusion Media and/or the data provider. All intellectual property rights are reserved by the providers and/or the exchange providing the data contained in this website.
Fusion Media may be compensated by the advertisers that appear on the website, based on your interaction with the advertisements or advertisers.
© 2007-2024 - Fusion Media Limited. All Rights Reserved.
