At the end of August I wrote "Q2 GDP - Nothing Good Happening Here" wherein I stated: "With GDP currently at 1.7%, as of the latest estimate, the decline in overall PCE, Goods, and Durable Goods, is very concerning about the next couple of quarters ahead. While the pick up in services spending (haircuts, accounting, legal, etc.) is currently keeping the current quarters GDP afloat - service related spending does not lead to substantially stronger economic output in the future. The real economic drivers are the manufacturing of goods, and unfortunately, that is where weakness is developing." The recent release of the final estimate of Q2 GDP, and the September's Durable Goods Report, confirmed that indeed the economy was far weaker than the headline releases, and media spin, suggested.
While the media quickly glossed over the surface of the report there were very important underlying variables that tell us much about the economy ahead. The first chart below shows the differences between the 1st and final estimate of 2nd quarter GDP.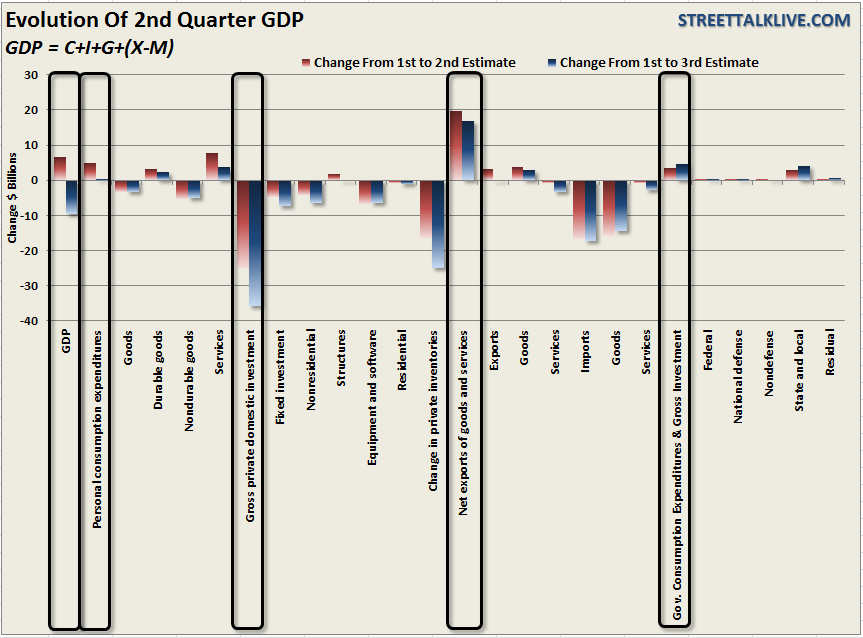
I have put the basic formula of the GDP calculation at the top of the chart and circled the relevant segments. The revisions between the first and final estimates of 2Q GDP showed that personal consumption expenditures (PCE) was just $0.5 billion stronger than originally estimated. However, this reflects a sharp downward revision of 90% from the 2nd estimate which had shown a $4.9 billion increase.
PCE is extremely important as it accounts for nearly 3/4ths of the entire GDP calculation. These final estimates fall in line with recent discussions about the slate of economic reports which have shown consistent signs of weakness. The purchases of Goods declined by $3.4 billion from the first estimate while durable goods, those lasting more than 3 years, were revised down by 19% to $2.5 billion. Non-durable goods shrank by $4.9 billion as consumers curbed spending on apparel, food and electronics. The saving grace, which pushed GDP from 1.5% to 1.7% previously, was the surge in spending on services which had surged by $7.7 billion. That surge had been a "head scratcher" considering the weakness seen in other reports. That overestimation was corrected in the final estimate of 2Q GDP as it was slashed by 52% to just $3.7 billion.
Exports, as discussed previously, have made up roughly 40% of corporate profits since the end of the last recession. The recent announcements by CAT, FDX, NSC, UPS and others, all discussed the rising weakness with international trading partners - primarily in the Eurozone and China. Not surprisingly we saw a decrease of $0.3 Billion in exports in 2Q GDP. This was a 110% decrease from the previous estimate of a $3.1 billion increase. This decrease in exports is very important as it relates to current forward earnings estimates and the belief that the U.S. can remain decoupled from the rest of the world. The following chart shows this is clearly not the case. 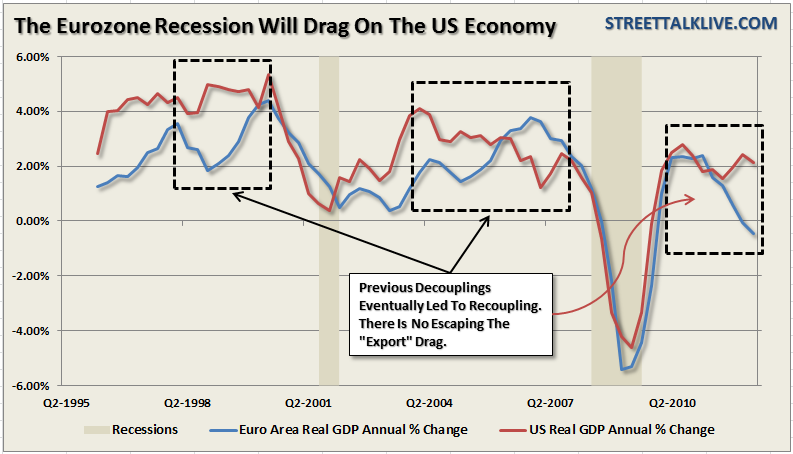
One of the big headwinds related to a continued push higher in the stock market is the rapidly deteriorating outlook for earnings. Analysts forward earnings expectations are still very high relative to what the current economic outlook is likely to produce. Coming negative revisions to estimates and corporate outlooks will likely shake the markets confidence.
Finally, a big negative revision in Private Investment, which was revised lower to show a negative $35.6 billion contraction shows you exactly why employment has remained weak. With forward outlooks of economic strength becoming less optimistic the drag from the reduction on capital spending is likely to continue.
As we have discussed previously this has been, by far, the weakest economic recovery of any post-WWII period. Unemployment remains elevated but has declined recently primarily due to the massive numbers either giving up looking for work or going onto some sort of welfare program that excludes them from being counted. Economic growth, such as it has been, can be primarily attributed to continued rounds of artificial interventions and stimulus programs designed to pull forward future economic activity. Of course, that begs the question of what will happen when we reach the future? Wages have remained stagnant, household net worth has declined for the longest period since the depression era and consumers are again being forced into debt to make ends meet. This all leads to a very sub-par economic growth rate as shown by the output gap between the real economy and what the economy should be producing.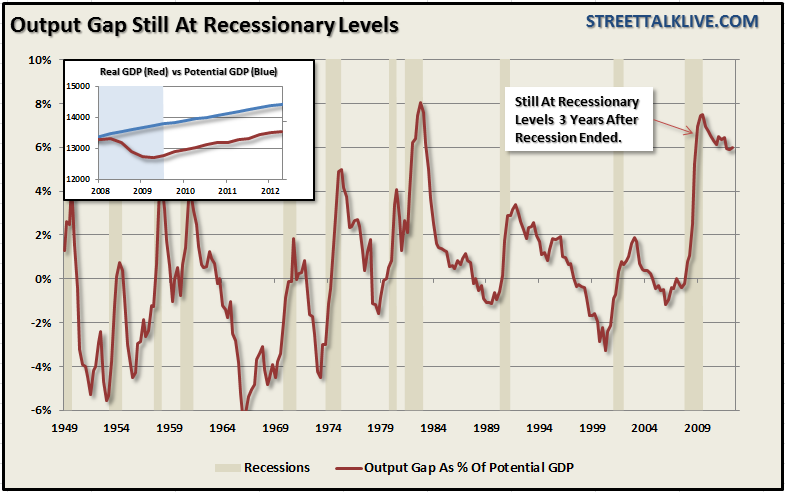
Real final sales, which measure GDP less the change in private inventories, also slipped back below the recessionary warning line as expected. Historically, whenever the year-over-year change in real final sales has fallen below 2% the economy has been in, or was about to be in, a recession. The 2011 recessionary warning of final sales was averted by the "mother nature" effect, as we have discussed previously, as the impact of an unseasonably warm winter, falling energy prices, and the restart of a post-Japanese earthquake manufacturing shutdown, all collided to give the economy a boost. Those tailwinds are not currently in the cards of rescuing the economy this time around. 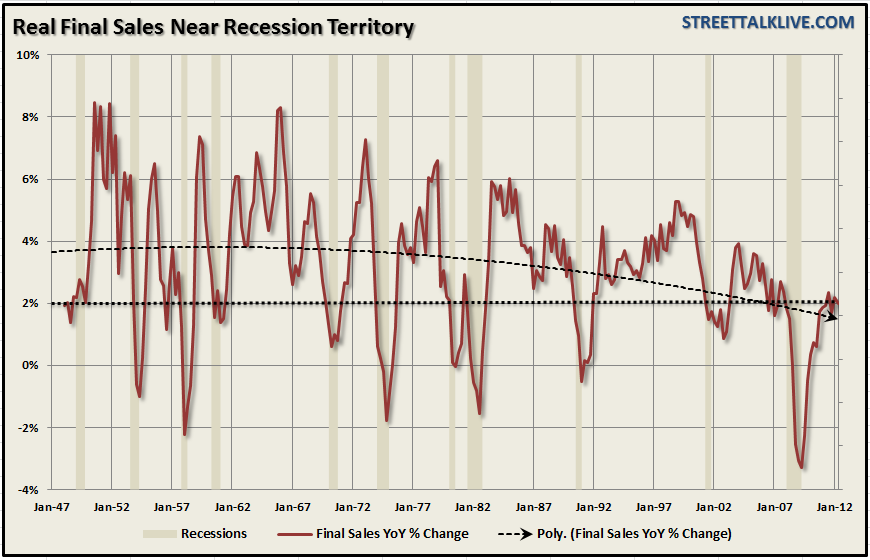
Furthermore, the recent builds in inventories, up $41.4 billion, are likely unwanted as product sits on the shelves collecting dust as consumer demand wanes. The real final sales number is a better indication of actual activity as sales declined from a quarterly change of .59% in the 1st quarter to .43% in the second quarter. This brings the year over year growth rate of real final sales to 1.99% down from 2.17% in the first quarter. The trend is clearly not one of economic strength.
The release of Durable Goods Orders supports this decline in final sales and confirms a spreading of economic weakness in the most important parts of the economic equation. New factory orders for durables plunged a whopping 13.2% in August after a downwardly revised 3.3% increase in July. Leading the decline was civilian aircraft orders which dropped an astounding 101.8% for the month. This has been one of those areas where new orders were being reported even as the economy weakened overseas - the reversion is now occurring. Motor vehicles also declined 10.9% in the month as reflected by the decline in PCE.
The chart below shows the annual changes in Durable Goods Orders as well as Nondefense Capital Goods Ex-Aircraft. Historically, when the annual rate of change of these two indexes have simultaneously printed a negative reading the economy was in, or near, a recession. As of the most recent report Durable Goods Orders showed a -6.7% annual decline while Nondefense Capital Goods showed a -3.1% decline. 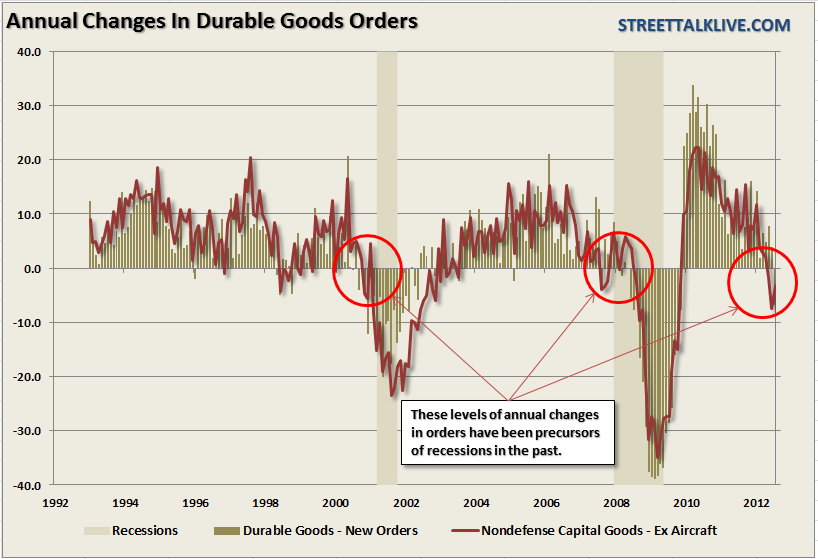
When trying to determine where the broader economy is headed an important indicator, outside of consumer spending, is Core Capital Expenditure Orders. As we have discussed many times previously changes to the economy occur at the margin. Therefore, by looking at core capital expenditures using a 3-month change of the annual rate of change - we can clearly see a weakening economic environment. Historically, when this indicator, like so many others, has declined below -2% the economy has either been in, or was about to be in a recession. Today, this indicator sits at -4.07%.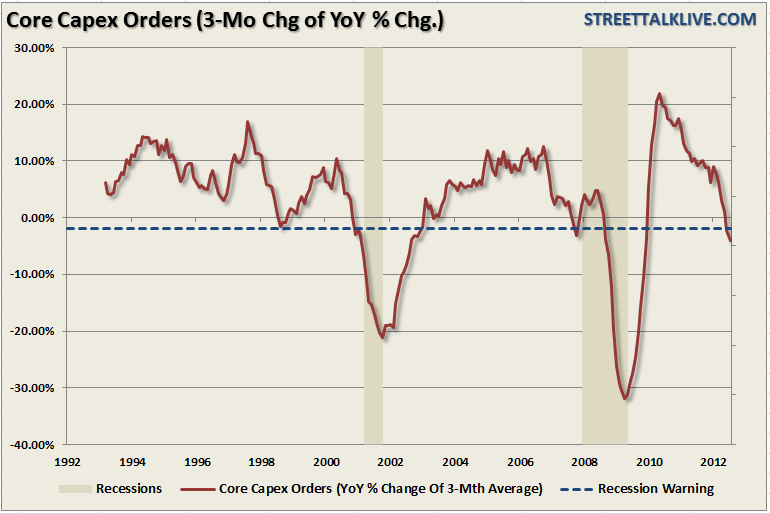
The bottom line is that there is further evidence of significant slowing in manufacturing in August. While there has been some minor upticks in some of the regional manufacturing surveys in September - these are most likely bumps within a more negative trend as the cross currents from slower growth in Asia, and recession in much of Europe, continues to nip away at the very modest economic growth in the U.S.
How Close To A Recession Are We?
The question now becomes with the economic data weakening how likely is the onset of a recession? The recent actions by the Federal Reserve to expand its bond buying programs by introducing a third Large Scale Asset Purchase program (QE-3) is clear evidence that they are worried about a further slide in the economy due to the pressures stemming from the Eurozone. As shown above there is obvious weakness seeping into two of the most critical components of the economic makeup - consumer and business spending.
At the current time the U.S. economy is technically not in a recession. However, as we have shown many times in the past that can change very quickly within a given quarter. The trend of the data is clearly negative, and in many cases, is getting worse. However, economists, and analysts, are quick to dismiss the trend of the data due to the Fed's recent endeavors into further bond buying programs. However, as we discussed recently, there is little evidence that these programs have much effect on economic growth. 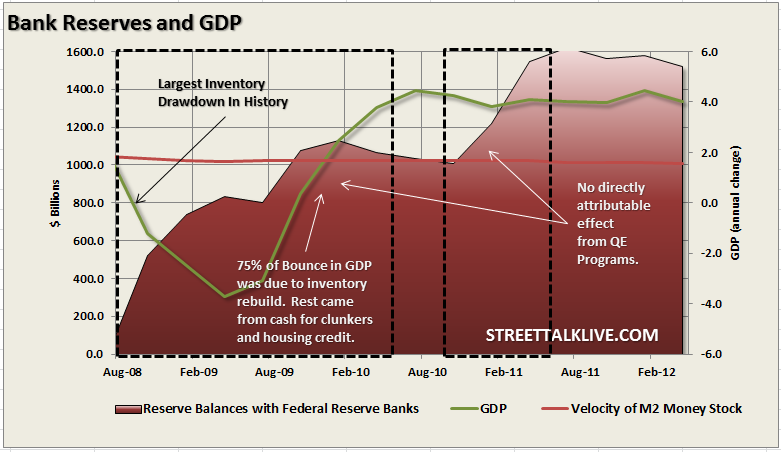
The problem is that there is little historical precedent in the U.S. as to whether maintaining ultra-low interest rate policies, and inducing liquidity, during a balance sheet deleveraging cycle, actually leads to an economic recovery. This is particularly troublesome when looking at a large portion of the population rapidly heading towards retirement whom will become net drawers versus net contributors to the economic system. Japan is the only country that has engaged in similar practices during a debt deleveraging cycle over the last 30 plus years. The Japan experience has been that of a slow growth economy that has experienced rolling recessions roughly every three years. Yet, we have embarked on the same path expecting a different result.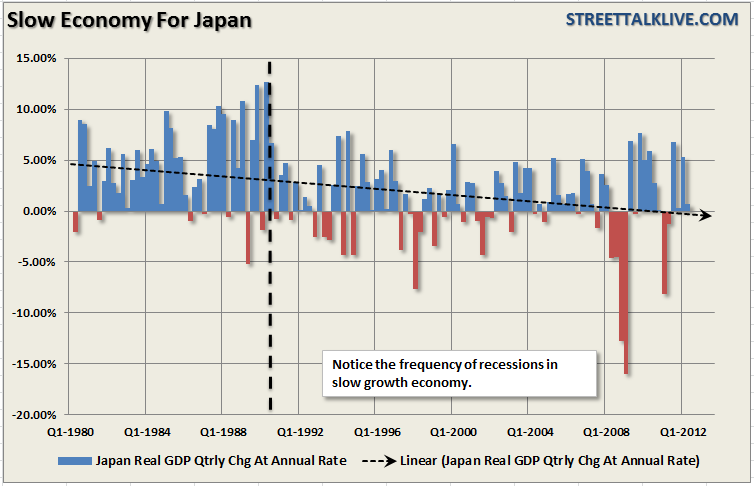
While I am not yet prepared to say that we are in a recession now, as opposed to the ECRI and John Hussman, my continued estimation is still that it is likely to occur in early 2013, however, at the current run rate of the data it could well be in the fourth quarter of this year. What is important, however, is that the evidence of the potential onset of recession is mounting.
As my friend Doug Short posted today: "...the real per-capita demand for durable goods had increased substantially since the trough at the end of the last recession. But orders remain far below their respective peaks near the turn of the century and earlier. Moreover, the trend in the 3-month moving average in the last chart above has been one of contraction in 2012. This fact, together with the particularly ugly August data, will be seen by ECRI and others in the 'we're already in a recession' camp as strong evidence supporting their view."
For investors this is not a time to be taking on tremendous amounts of risk within portfolios. While markets can sometimes do irrational things in the short term - it is the underlying economics, and fundamentals, that drive long term portfolio returns. Taking on risk at the wrong times, trying to chase returns, can lead you into devastating losses that take the entire next upswing to recover. This has happened twice already since the turn of the century and it will happen again - it is only a function of time. The important point for investors, who have a limited amount of time to plan and save for retirement, is that "hope" and "getting back to even" are not successful investment strategies.
- English (UK)
- English (India)
- English (Canada)
- English (Australia)
- English (South Africa)
- English (Philippines)
- English (Nigeria)
- Deutsch
- Español (España)
- Español (México)
- Français
- Italiano
- Nederlands
- Português (Portugal)
- Polski
- Português (Brasil)
- Русский
- Türkçe
- العربية
- Ελληνικά
- Svenska
- Suomi
- עברית
- 日本語
- 한국어
- 简体中文
- 繁體中文
- Bahasa Indonesia
- Bahasa Melayu
- ไทย
- Tiếng Việt
- हिंदी
GDP And Durable Goods - Heading To Recession?
Published 09/28/2012, 12:59 AM
Updated 02/15/2024, 03:10 AM
GDP And Durable Goods - Heading To Recession?
3rd party Ad. Not an offer or recommendation by Investing.com. See disclosure here or
remove ads
.
Latest comments
Install Our App
Risk Disclosure: Trading in financial instruments and/or cryptocurrencies involves high risks including the risk of losing some, or all, of your investment amount, and may not be suitable for all investors. Prices of cryptocurrencies are extremely volatile and may be affected by external factors such as financial, regulatory or political events. Trading on margin increases the financial risks.
Before deciding to trade in financial instrument or cryptocurrencies you should be fully informed of the risks and costs associated with trading the financial markets, carefully consider your investment objectives, level of experience, and risk appetite, and seek professional advice where needed.
Fusion Media would like to remind you that the data contained in this website is not necessarily real-time nor accurate. The data and prices on the website are not necessarily provided by any market or exchange, but may be provided by market makers, and so prices may not be accurate and may differ from the actual price at any given market, meaning prices are indicative and not appropriate for trading purposes. Fusion Media and any provider of the data contained in this website will not accept liability for any loss or damage as a result of your trading, or your reliance on the information contained within this website.
It is prohibited to use, store, reproduce, display, modify, transmit or distribute the data contained in this website without the explicit prior written permission of Fusion Media and/or the data provider. All intellectual property rights are reserved by the providers and/or the exchange providing the data contained in this website.
Fusion Media may be compensated by the advertisers that appear on the website, based on your interaction with the advertisements or advertisers.
© 2007-2024 - Fusion Media Limited. All Rights Reserved.
