Gold remains like the banks – get out while you can – with both the banks and gold looking more bearish by the day, but let’s focus on gold here, with a quick peek at silver too.
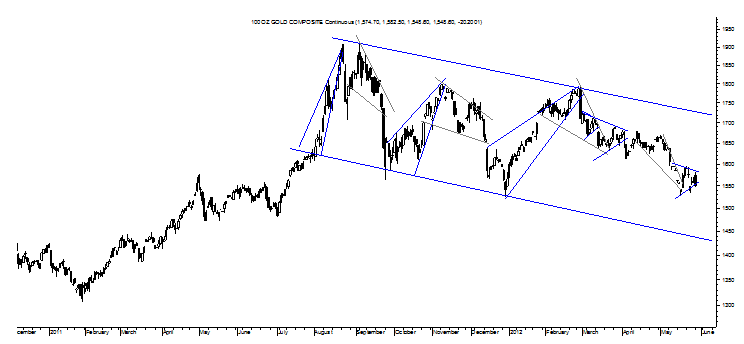
As can be seen in the chart of gold above, a nice Bear Pennant is forming and one that confirms at $1,529 per ounce for an aggressive target of $1,387 per ounce and a level that is below the Descending Trend Channel and the goal of what shows as a very nice Descending Triangle in weekly form with a target so low you don’t want to know unless you’re a bear gold like me.
Let’s save those beautiful and very bearish long-term charts for another time, though, and stick with the relative near-term to consider the other possibility offered by the recent consolidation and that is a Double Bottom that confirms at $1,594 per ounce for a target of $1,659 per ounce.
Now that sort of brief bounce could occur from a technical standpoint and it should be taken very seriously if gold rises above $1,594 per ounce in the near-term, but it is very likely to be brief and something worth paying attention to only for a quick and very disciplined trade because it will be forgotten entirely when the truly bearish nature of gold’s long-term technicals are analyzed, as was done in last September’s Gold to Fall By 50%.
Put otherwise, gold’s going to drop big and probably this year into next year and any sort of near-term pop that may or very well may not happen should be treated with caution considering the violence with which gold may fall relatively soon.
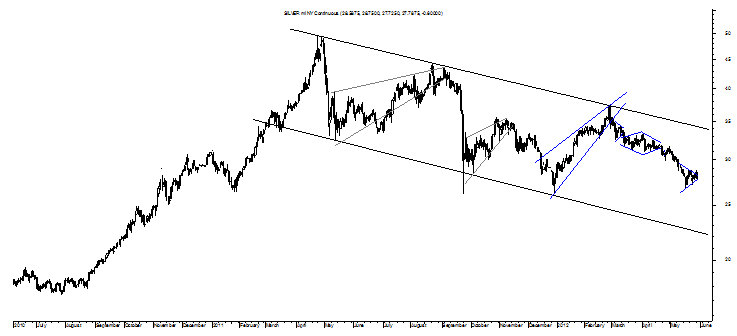
Such a severe decline – truly a correction – stands out even more in silver’s long-term charts to be shown here again at another time while its near-term chart is showing that Bear Pennant or Double Bottom pattern with its Descending Trend Channel appearing to be pulling silver down toward its $22 per ounce bottom trendline.
Let’s think about the possible brief pop potential, though, on what would be a Double Bottom and it confirms at $28.89 per ounce for a target of about $31 per ounce while its Bear Pennant opposite confirms at $26.75 for a target of $24.61 and a level that will confirm its very bearish sub-$20 Descending Triangle to be discussed at another time.
Interestingly, whether silver uses the recent consolidation to pop or just drop is nearly irrelevant to that bigger bearish aspect with the potential pop working well to fill that pattern out more while an immediate drop fits with its fulfilling soon.
It is just that sort of a fast fulfillment to the long-term bearish aspects showing in the charts of gold and silver that suggest each will drop fast in a rush to get liquid.
- English (UK)
- English (India)
- English (Canada)
- English (Australia)
- English (South Africa)
- English (Philippines)
- English (Nigeria)
- Deutsch
- Español (España)
- Español (México)
- Français
- Italiano
- Nederlands
- Português (Portugal)
- Polski
- Português (Brasil)
- Русский
- Türkçe
- العربية
- Ελληνικά
- Svenska
- Suomi
- עברית
- 日本語
- 한국어
- 简体中文
- 繁體中文
- Bahasa Indonesia
- Bahasa Melayu
- ไทย
- Tiếng Việt
- हिंदी
Gold And Silver Getting Ready To Drop On A Rush To Get Liquid
Published 05/30/2012, 12:35 AM
Updated 07/09/2023, 06:31 AM
Gold And Silver Getting Ready To Drop On A Rush To Get Liquid
3rd party Ad. Not an offer or recommendation by Investing.com. See disclosure here or
remove ads
.
Latest comments
Install Our App
Risk Disclosure: Trading in financial instruments and/or cryptocurrencies involves high risks including the risk of losing some, or all, of your investment amount, and may not be suitable for all investors. Prices of cryptocurrencies are extremely volatile and may be affected by external factors such as financial, regulatory or political events. Trading on margin increases the financial risks.
Before deciding to trade in financial instrument or cryptocurrencies you should be fully informed of the risks and costs associated with trading the financial markets, carefully consider your investment objectives, level of experience, and risk appetite, and seek professional advice where needed.
Fusion Media would like to remind you that the data contained in this website is not necessarily real-time nor accurate. The data and prices on the website are not necessarily provided by any market or exchange, but may be provided by market makers, and so prices may not be accurate and may differ from the actual price at any given market, meaning prices are indicative and not appropriate for trading purposes. Fusion Media and any provider of the data contained in this website will not accept liability for any loss or damage as a result of your trading, or your reliance on the information contained within this website.
It is prohibited to use, store, reproduce, display, modify, transmit or distribute the data contained in this website without the explicit prior written permission of Fusion Media and/or the data provider. All intellectual property rights are reserved by the providers and/or the exchange providing the data contained in this website.
Fusion Media may be compensated by the advertisers that appear on the website, based on your interaction with the advertisements or advertisers.
© 2007-2024 - Fusion Media Limited. All Rights Reserved.
