Last week was a veritable rollercoaster. The economic woes of the eurozone continue to take centre stage in global finance. Europe is not, however, the only economy to show signs of slowing down. Chinese authorities saw fit to reduce the key interest rate in the People’s Republic just before the weekend, which was brimming with releases of economic data. Even in Canada, the economic news has given cause for concern. Employment figures released on Friday showed 7,700 jobs created, including some 6,300 part-time jobs, far short of levels in previous months.
Canada
We are looking at a very quiet week in terms of Canadian economic news. The first significant news is expected on Thursday morning with the release of the Capacity Utilization Rate for the first quarter of 2012. The market expects capacity utilization to climb to 81.2% from 80.5% in the previous quarter. Then on Friday morning we will have Manufacturing Sales data for April. Here again the market is counting on growth, predicting a 2.2% increase. This compares to 1.9% growth in March.
United States
The week will be much more newsworthy south of the border. Two members of the Fed’s FOMC Committee will be giving speeches on Monday. This will be followed by the release of the Retail Sales figure, which is expected to be down 0.1%, and the Producer Price Index, for which a 0.6% decline from the preceding month is forecast. On Thursday figures will be released on the Consumer Price Index and initial jobless claims. The market expects a slight 0.2% reduction in prices month over month and 378,000 jobless claims. Lastly, the week will end with the Michigan Consumer Sentiment Index for June. The market expects it to fall to 77.5, from 79.3 for May.
International
In international news, this week we still keep an eye trained on developments in Europe. Over the weekend, a wide range of data were published in China. On Tuesday, Britain will publish its Gross Domestic Product for May. Then on Wednesday Germany will release its Consumer Price Index for May, and on Thursday we will learn the Consumer Price Index for the eurozone.
The Loonie
"Because things are the way they are, things will not stay the way they are." – Bertolt Brecht
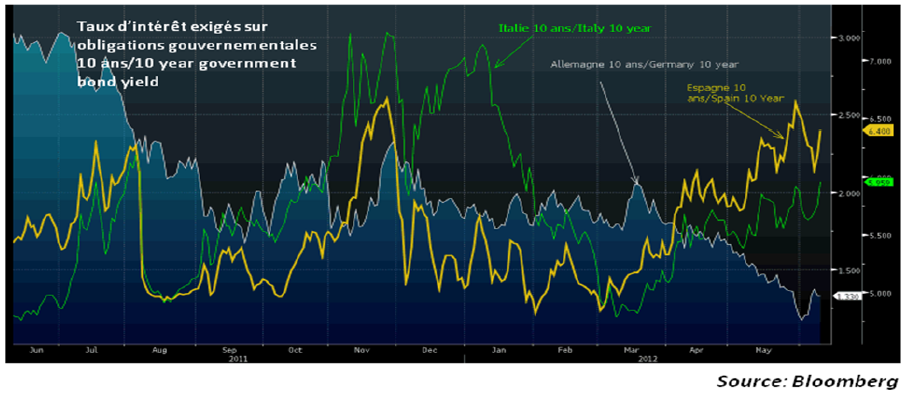
Since the turmoil in Europe has been buffeting markets for some time now, market participants have been using different tools to try to determine just how serious the situation is. This week we describe a tool that we use to quantify the risk associated with a country’s sovereign debt and, by extension, the level of uncertainty that market participants associate with that risk. This indicator is the interest rate charged on debt issued by eurozone countries. When a country needs financing, it turns to the financial markets and issues bonds to borrow the funds it needs. The interest rates at which the country borrows are perceived to measure the risk associated with that country. The following graph shows changes in the interest rates charged by the market on 10-year bonds issued by Italy, Spain and Germany over the last year.
As you can see, the interest rates on debt issued by Italy and Spain, the third and fourth largest economies in the eurozone, are extremely high compared to rates on Germany’s debt (since Germany’s economy is perceived as the strongest in the European Union, its debt is deemed to carry the least risk). Despite lower key interest rates and the implementation by the European Central Bank of two long-term refinancing operations (LTROs), market rates have nevertheless risen to practically unsustainable levels. These are only band-aid solutions and have not really addressed the underlying injury, so the slightest scratch risks tearing the wound open again and pushing market rates to levels where Spain and Italy will be forced to seek international assistance. A week away from the Greek elections, this scratch may be inflicted fairly soon, and the U.S. dollar could reach record levels for 2012.
Technical Analysis: USD/CAD Pair (Friday, 8 of June 2012)
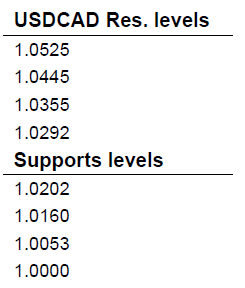
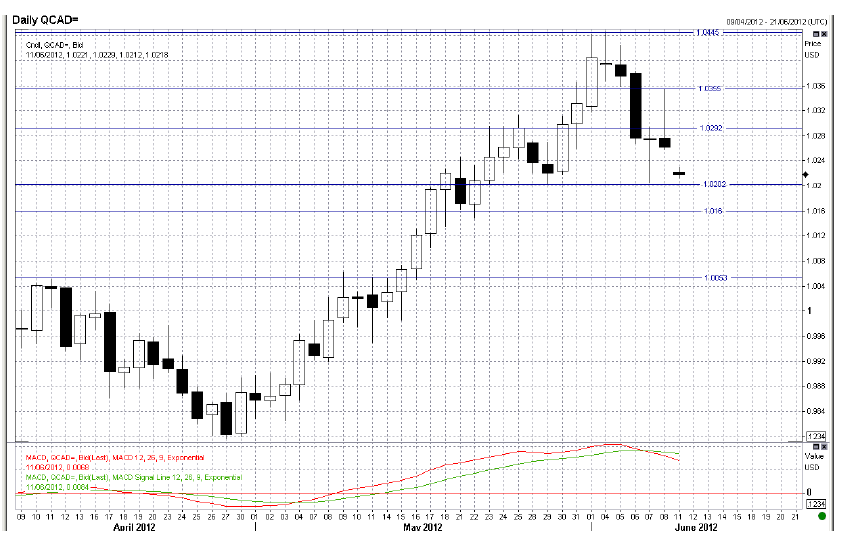
It was a week of many turnovers for the USD/CAD pair. Indeed, after completing a consistent rise last May, it seems that the U.S. dollar is now showing signs of losing steam and has, in recent days, given back some of the ground that was gained against the Canadian dollar. This is supported by the signal given by the Moving Average Divergence Convergence (MACD) technical indicator. The signal was given when the fast line (in red) fell below the slow line (in green) late last week. The announcement over the weekend that Spanish banks would be bailed out further widened the gap between the two indicator’s lines and thus strengthened the signal given by MACD. Over the short-term the USD/CAD pair should find support near the 1.0202 and 1.0160 levels. In the case of a rebound, 1.0350 has proven to be a strong resistance level last Friday. Ultimately, the USD/CAD pair should find resistance around the 1.0445 level.

Fixed Income
Yields rose last week from their lowest levels as investors believe another round of stimulus might be around the corner. Hope for a coordinated monetary intervention by G7 central banks and finance ministers lead to a good start for risky assets last week. Stocks moved higher and yields came back from their low reached at the end of last month.
The Bank of Canada kept rates unchanged as expected on Tuesday, prolonging its long pause, but didn’t signal a potential cut so short-term yields rose slightly. Flows on the 20yr and 30yr sectors also pushed Canadian swap spreads higher, making it more expensive to pay fixed especially for longer maturities.
Then on Friday, Stat Can announced job creations had slowed last month in Canada. The decrease had been expected by most traders and economists given the astonishing 140,000 additions of the past two months. Over the week end, Spain requested a 125B bailout from other EU nations to restructure its banking sector. Spain's Prime Minister Mariano Rajoy said this amount will be plenty enough to get it done once and for all, and start on new ground.
We will see how the market reacts to this fourth EU bailout, but stocks and yields should increase as analysts believe it's good that the news of the aid came ahead of the Greek elections. Also, check US retail sales on Wednesday, as well as CPI data from both Europe and the US on Thursday.
Commodities
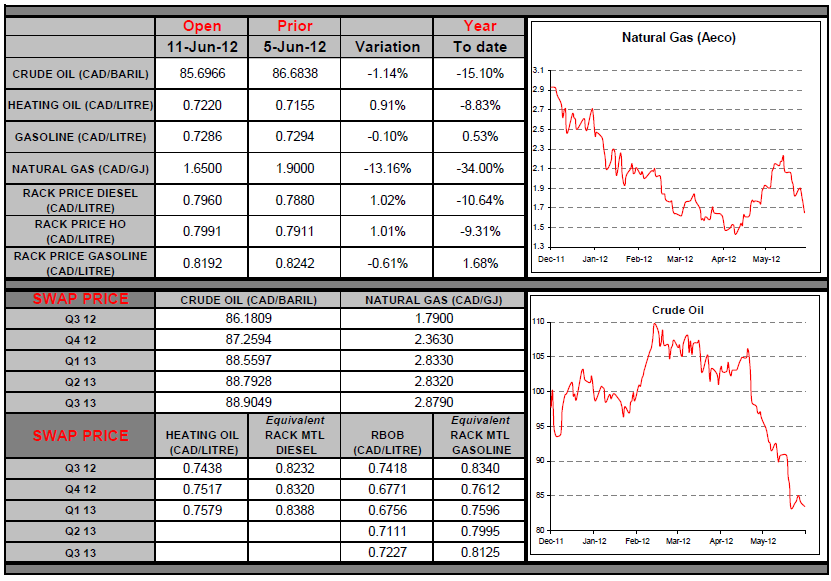
The price of oil slipped at the end of last week due to slower global economic activity, which raised fears of falling demand for oil products. Given these risks, it will be interesting to see how the Fed and the European Central Bank react, as they may soon need to intervene to support markets. Concerted action by the main central banks would be good for commodity prices. Last week the drop in energy prices again spurred many clients to action. The rack price for diesel across Canada is now at its lowest level since bottoming out on June 26, 2011, when the markets were panicking and the situation in Europe had everyone’s attention. The rack price fell 14% between the high in April 2011 and the low in June of the same year. At this point it has fallen 17.4% from its peak in February 2012. Since the heating oil market still cannot be used to protect diesel expenditures beyond March 2013, the option of taking action directly on crude prices in Canadian dollars is becoming increasingly attractive.
Last Week At A Glance
Canada – In May, the Labour Force Survey showed a 7.7K increase in Canadian employment. The unemployment rate remained unchanged at 7.3%. The participation rate was also unchanged at 66.8%. Private-sector employment fell 22.5K, giving back some of the sharp gains in the prior month. The services sector lost 3K jobs (the second monthly drop in a row) but the goods sector saw an increase of 11K jobs (after recording the largest monthly increase on record in April). There were net job losses in construction and the resources sector, but those were more than offset by a 36K increase in the manufacturing sector.
Full-time employment rose by just 1K after posting strong gains in March and April. Part-time employment was up 6K. Hours worked rose 0.2%. May's LFS report was better than expected given that the gains came on top of sharp increases in the prior two months. The labour market’s showing in the first five months of the year (+30K/month on average) was much better than for the same period the year before (+27K/month). Private sector hiring from January to May of this year was twice what it was over the corresponding period the previous year. Growth in hours worked is now tracking at 1.9% annualized in Q2 versus 0.7% in Q1.
In April, the merchandise trade balance slipped in the red for the first time in six months. The CAD 367-million deficit was the product of falling exports (-1.2%) and rising imports (+0.1%). The result was worse than expected by consensus. Lower exports of energy, industrial goods, machinery and equipment more than offset higher auto exports. Lower imports of energy products were offset by higher imports elsewhere. In real terms, exports rose 0.7% while imports sagged 0.1%. The trade report was better in the details, as the drop in exports was due entirely to lower prices. This second consecutive increase in export volumes means that real export growth is tracking at +4.9% in Q2, close to Q1's +5%. Still in April, Canadian building permits fell 5.2% in dollar terms, reversing all of the gains in the prior month.
The decline was worse than expected by consensus. The non-residential sector (-8.4%) was the main driver behind the drop, although residential permits were down as well (-2.8%). Permit applications fell 2% for singles and 4% for multiples. In real terms (i.e., number of residential units), permits were down 4% for singles and 9.5% for multiples. Back in May, Canadian housing starts dove 13% to 211.4K, largely reversing April's gains. Multiples plunged 20.7% while singles sank 4.2%. Lower urban starts more than offset higher starts in rural areas. Quebec recorded the steepest decline in urban starts (- 36%), giving back some of the prior month's gains. Ontario witnessed a sharp drop as well (-18%) after a strong showing in April.
As expected, the Bank of Canada left its overnight rate unchanged at 1.00% and toned down its hawkish language, acknowledging that global economic growth had weakened and asserting that "risks remain skewed to the downside." The BoC ended its press release on this note: “to the extent that the economic expansion continues and the current excess supply in the economy is gradually absorbed, some modest withdrawal of the present considerable monetary policy stimulus may become appropriate.” Our own growth forecast suggests that it will take longer for the output gap to close than the BoC projected in April. We continue to expect the Bank to stay on hold until next year.
United States – In April, the trade deficit shrank to $50.1 billion from $52.6 billion the previous month. Exports fell $1.5 billion to $184.4 billion while imports declined $4.1 billion to $237.1 billion. The deficit over the threemonths ended in April averaged $49.4 billion, compared with $44.4 billion for the corresponding period the year before. Still in April, factory orders fell 0.6%, confounding consensus expectations for a gain. Making matters worse was the downward revision to March orders, which contracted 2.1% instead of the 1.5% previously reported. Durable-goods orders were revised down as well, from +0.2% to a flat reading.
Orders ex-transportation fell by 1.1% instead of by the 0.6% initially reported. Non-defence capital goods orders excluding aircraft contracted for a second straight month (-2.1%). Total factory shipments recorded their first decline in five months (-0.3%). Shipments of non-defence capital goods ex-aircraft retreated 1.5%, reversing much of March's gains. The factory data were quite weak, which heralds a deceleration in investment in Q2. Shipments of non-defence capital goods ex-aircraft (a proxy for business investment spending) is tracking at just +0.5% annualized in Q2 (compared with +5.6% in Q1). This is consistent with a further moderation of U.S. GDP growth in the current quarter.
In May, the non-manufacturing ISM index climbed two ticks to 53.7. Most important, the strong new-orders sub-index in both the non-manufacturing (55.5) and the manufacturing (60.1 as of last week's release) reports suggests that the soft orders in March and April were a transient occurrence. This said, the non-manufacturing report also contained its share of less encouraging data. Among these, the employment index slumped to 50.8, its weakest reading since last December. In other news, the Fed's Beige Book provided the latest information on the U.S. economy, covering the period up to May 25. According to the report, economic activity continued to expand "at a moderate pace." Of the 12 districts, seven qualified the pace as "moderate" and three as "modest." The last two were even less upbeat. Hiring was reported to be "steady” or had “increased slightly."
Euro Area – The first estimate from Eurostat showed that from March to April 2012, the volume of retail trade fell 1.0% in the euro area. This followed a gain of 0.3% the month before. Nonetheless, sales declined in four of the six months ending in April. On a regional basis, retail trade shrank 1.5% in France and 2.4% in Spain. Austria and Finland were among the worst performers in this regard, with pullbacks of 3.5% and 2.7%, respectively. Figures were not yet available for Italy. Germany, however, registered a gain of 0.6%.
