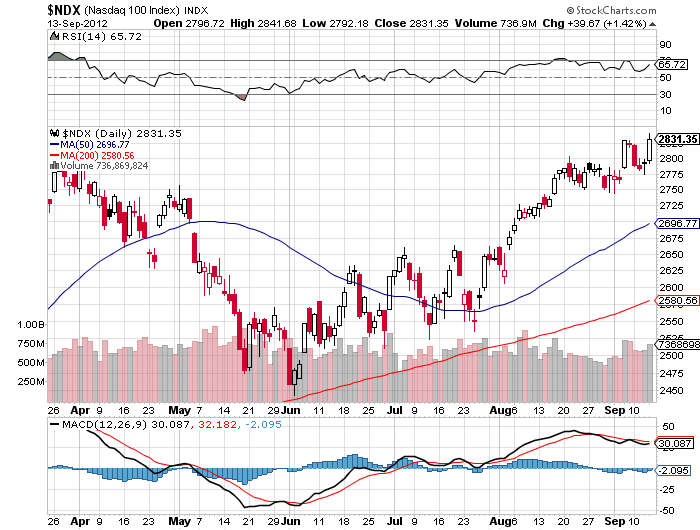
The Nasdaq-100 formed an evening star candlestick pattern Monday after making a new minor high on last week's Thursday. The evening star pattern should have bearish implications for the next few days. The previous minor low is now at $2,750.
Bonds & Crude Intraday
Bonds formed an intraday triple top and confirmed the triple top with a breakout to the downside. The minimum implied measured move is $150. Further, bonds made a lower low today, continuing the down trend.
Crude oil was declining, lower lows and lower highs, and is trading near $100. Crude was in the process of forming a bottom. Confirmation of the bottom occurred. The crude oil bottom was an inverse head & shoulders pattern. The minimum implied measured move is $102.
Trendlines & Moving Average
As of writing, the market is still in an intermediate up-trend: The Nasdaq-100 is trading above the rising 50-day simple moving average.
Momentum
The 12-day rate of change indicator is declining and above equilibrium: That suggests the price is above where it was 12 days ago and the difference is shrinking. Further, the 12-day ROC is forming negative divergences. The 24-day rate of change indicator is flattening and above equilibrium. The 14-day RSI is suggesting the market is bullish. The 14-day slow stochastic indicator is declining after reaching overbought and recently formed a bullish crossover. The 14-day ADX is increasing which suggests the market is trending. The market is above the parabolic SAR: a sign the minor trend is towards higher prices.
Dow Jones industrial average & S&P 500
Both averages are confirming the bullish sentiment.
Energy versus Financials
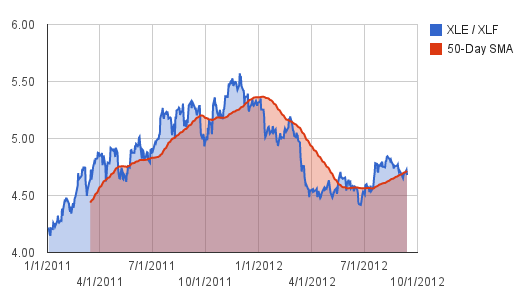
The energy firms have begun to outperform, the ratio is above the rising 50-day simple moving average, the financial firms: Markets are beginning to price in inflation. Typically, energy outperforms towards the end of the cycle. 
Energy versus Utilities
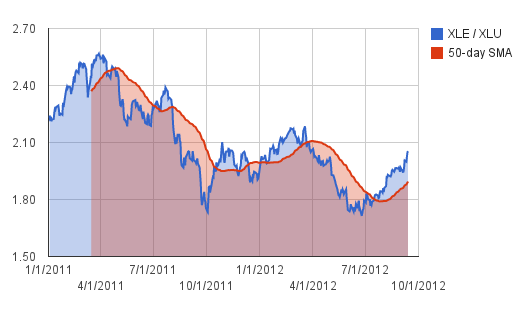
Currently, energy is outperforming the utilities: Markets are pricing in inflation. That said, overall the utilities are outperforming energy as deflationary risks linger.
Stop Loss Level
The protective stop loss level is $2,700: That level represents the worst case loss level and trades may be exited prior to the market reaching that level.
Conclusion: Bullish, caution warranted.
www.proproptrading.com will be live soon. Subscribers will get research notes e-mailed to them with the purchase of an annual membership of $10-year. Research notes will combine the technical and valuation perspectives, initially.
Disclaimer: This article is not meant to establish or continue an investment advisory relationship. Before investing, readers should consult their financial advisor. Christopher Grosvenor does not know your financial situation and ability to bear risk and thus his opinions may not be suitable for all investors.
- English (UK)
- English (India)
- English (Canada)
- English (Australia)
- English (South Africa)
- English (Philippines)
- English (Nigeria)
- Deutsch
- Español (España)
- Español (México)
- Français
- Italiano
- Nederlands
- Português (Portugal)
- Polski
- Português (Brasil)
- Русский
- Türkçe
- العربية
- Ελληνικά
- Svenska
- Suomi
- עברית
- 日本語
- 한국어
- 简体中文
- 繁體中文
- Bahasa Indonesia
- Bahasa Melayu
- ไทย
- Tiếng Việt
- हिंदी
Nasdaq Trending Higher
Published 09/14/2012, 08:00 AM
Updated 07/09/2023, 06:31 AM
Nasdaq Trending Higher
Peak-and-Trough Progression
3rd party Ad. Not an offer or recommendation by Investing.com. See disclosure here or
remove ads
.
Latest comments
Install Our App
Risk Disclosure: Trading in financial instruments and/or cryptocurrencies involves high risks including the risk of losing some, or all, of your investment amount, and may not be suitable for all investors. Prices of cryptocurrencies are extremely volatile and may be affected by external factors such as financial, regulatory or political events. Trading on margin increases the financial risks.
Before deciding to trade in financial instrument or cryptocurrencies you should be fully informed of the risks and costs associated with trading the financial markets, carefully consider your investment objectives, level of experience, and risk appetite, and seek professional advice where needed.
Fusion Media would like to remind you that the data contained in this website is not necessarily real-time nor accurate. The data and prices on the website are not necessarily provided by any market or exchange, but may be provided by market makers, and so prices may not be accurate and may differ from the actual price at any given market, meaning prices are indicative and not appropriate for trading purposes. Fusion Media and any provider of the data contained in this website will not accept liability for any loss or damage as a result of your trading, or your reliance on the information contained within this website.
It is prohibited to use, store, reproduce, display, modify, transmit or distribute the data contained in this website without the explicit prior written permission of Fusion Media and/or the data provider. All intellectual property rights are reserved by the providers and/or the exchange providing the data contained in this website.
Fusion Media may be compensated by the advertisers that appear on the website, based on your interaction with the advertisements or advertisers.
© 2007-2024 - Fusion Media Limited. All Rights Reserved.
