PepsiCo, Inc. (NASDAQ:PEP) has reported fourth-quarter 2018 results, wherein earnings were in line with estimates while sales topped. With this, the company reported sales beat in six of the last eight quarters. Further, it recorded positive earnings surprise in the preceding 11 quarters.
The improvement in earnings can be mainly attributed to strong performances in the company’s international divisions, driven by solid revenue growth in developing and emerging markets. Additionally, strong net revenues and operating profit growth at Frito-Lay North America, along with improvement in the North America Beverages segment, aided results.
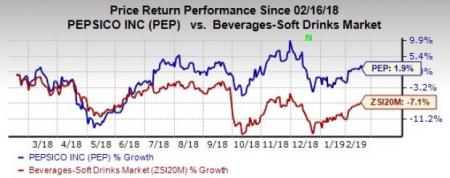
PepsiCo’s shares did not show much reaction to strong fourth-quarter results. However, shares of this Zacks Rank #3 (Hold) company have gained 1.9% in the past year against the industry’s 7.1% decline.
Earnings
PepsiCo’s fourth-quarter core earnings per share (EPS) of $1.49 were in line with the Zacks Consensus Estimate and increased 13.7% year over year. In constant-currency terms, core earnings improved 17% from the year-ago period.
Pepsico, Inc. Price, Consensus and EPS Surprise
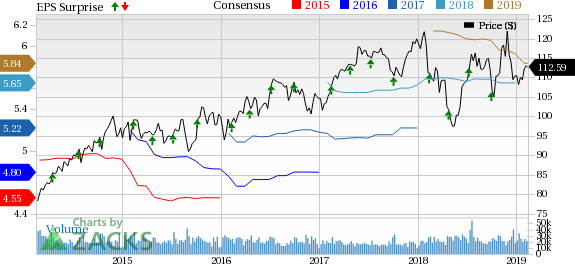
Pepsico, Inc. Price, Consensus and EPS Surprise | Pepsico, Inc. Quote
The company’s reported earnings of $4.83 per share improved substantially from loss of 50 cents per share in the prior-year quarter. Foreign exchange translation unfavorably impacted reported EPS by 2 percentage points.
Sales
Net revenues of $19,524 million were flat with the prior-year quarter but surpassed the Zacks Consensus Estimate of $19,515 million. Notably, revenues included negative impact of 4 percentage points from foreign exchange (Fx), and 1 percentage point from acquisitions and divestitures. Excluding the impacts of Fx, acquisitions, divestitures, structural and other changes, revenues increased 4.6% on an organic basis.
This was primarily driven by strength in the majority of the company’s businesses — including Frito-Lay North America, each of the international divisions and North America Beverages. Notably, Latin America; Asia, Middle East and North Africa (AMENA); Europe Sub-Saharan Africa (ESSA); North America Beverages (NAB); and Frito-Lay North America (FLNA) segments reported organic revenue growth in the fourth quarter.
Total volume was flat in the reported quarter compared with 2% growth witnessed in the third quarter of 2018. While organic snacks/food volume increased 1% (down from 3% growth witnessed in the third quarter), beverage volume was flat (down from 2.5% increase in the third quarter).
Segment Details
Reported revenues declined 8% at AMENA, 3% at ESSA, 1% at Latin America and 0.5% at QFNA segments. Meanwhile, net revenues improved 2% at NAB and 4% at FLNA segments. Organic revenues improved 4% at FLNA, 2% at NAB, 10% at Latin America, 7% at ESSSA and 5% at AMENA. However, organic revenues remained flat for the QFNA segment.
Operating profits (on a reported basis) decreased 12% for NAB and 46% for AMENA segments. However, it grew 23% for ESSA, 9% for Latin America, 8% for FLNA and 5% for QFNA segments.
Margins
On a consolidated basis, reported gross margin expanded 75 basis points (bps) while core gross margin improved 90 bps. Reported operating margin declined 70 bps while core operating margin expanded 55 bps.
Financials
The company ended 2018 with cash and cash equivalents of $8,721 million, long-term debt of $28,295 million, and shareholders’ equity (excluding non-controlling interest) of $14,518 million.
Net cash provided by operating activities was $9,415 million as of Dec 29, 2018, compared with $10,030 million in 2017.
Guidance
In 2019, PepsiCo expects to further build on the momentum witnessed in 2018. The company plans to continue investing in capabilities that will position it for growth in the future.
For 2019, the company anticipates organic revenue growth of 4%, with nearly 1% decline in core constant currency EPS. The decline in EPS is likely to be driven by impacts of incremental investments to strengthen its business in 2019, higher effective tax rate guidance, and lapping of a number of asset sale and refranchising gains that occurred in 2018. Notably, effective tax rate is estimated to be nearly 21% in 2019 compared with 18.8% in 2018.
Moreover, the company estimates currency to impact both reported revenues and EPS by nearly 2 percentage points in 2019, based on current rates. Due to the above factors, it anticipates core earnings of $5.50 per share in 2019, reflecting a 3% decline from $5.66 reported in 2018.
However, it expects core constant currency EPS to increase high-single digit in 2020.
Further, management plans to return $8 billion to shareholders through dividends worth $5 billion and share repurchases worth $3 billion. Free cash flow is estimated at around $5 billion. Operating cash flow is expected to be nearly $9 billion, with net capital spending of $4.5 billion.
For the longer term, the company projects organic revenue growth of 4-6%, with core operating margin expansion of 20-30 bps. Further, core constant currency EPS is expected to increase in a high-single digit.
Moreover, the company now estimates generating productivity savings of at least $1 billion annually through 2023 (an expansion from the prior target of $1 billion annual savings through 2019). As part of its restructuring actions, it is likely to incur pre-tax charges of nearly $2.5 billion through 2023 (with cash portion of nearly $1.6 billion).
Don’t Miss These Better-Ranked Soft-Drink Stocks
Monster Beverage Corporation (NASDAQ:MNST) , with long-term earnings growth rate of 16%, currently carries a Zacks Rank #2 (Buy). You can see the complete list of today’s Zacks #1 Rank (Strong Buy) stocks here.
Coca-Cola (NYSE:KO) European Partners PLC (NYSE:CCEP) , with long-term earnings growth rate of 8.7%, presently carries a Zacks Rank #2.
New Age Beverage Corporation (NASDAQ:NBEV) delivered a positive earnings surprise of 11.1% in the last reported quarter. It currently carries a Zacks Rank #2.
Zacks' Top 10 Stocks for 2019
In addition to the stocks discussed above, wouldn't you like to know about our 10 finest buy-and-holds for the year?
From more than 4,000 companies covered by the Zacks Rank, these 10 were picked by a process that consistently beats the market. Even during 2018 while the market dropped -5.2%, our Top 10s were up well into double-digits. And during bullish 2012 – 2017, they soared far above the market's +126.3%, reaching +181.9%.
This year, the portfolio features a player that thrives on volatility, an AI comer, and a dynamic tech company that helps doctors deliver better patient outcomes at lower costs.
See Stocks Today >>
Pepsico, Inc. (PEP): Free Stock Analysis Report
Monster Beverage Corporation (MNST): Free Stock Analysis Report
Coca-Cola European Partners PLC (CCEP): Free Stock Analysis Report
New Age Beverage Corporation (NBEV): Free Stock Analysis Report
Original post
Zacks Investment Research