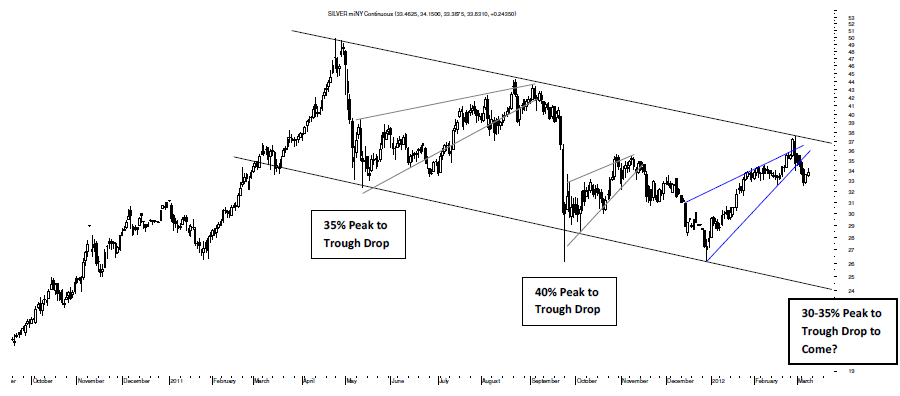
It’s been nearly a year since the 35% correction in silver last May and almost six months since the 40% free fall in silver last September, but it seems that yet another aftershock drop to 2011’s parabolic climb may be on the way yet.
As can be seen in the chart above, silver’s intermediate-term trend is down per a fairly reliable Descending Trend Channel with silver having been rebuffed by the resistance of the Channel’s top trendline recently on a strong Pipe Top pattern that is confirmed for its target of about $30 per ounce.
More worrisome, though, is silver’s current and confirmed Rising Wedge in blue with a target of about $26 per ounce and a pattern that could begin to take silver down any day now or may hold off for another week to few weeks in sideways trading between about $32 and $36 per ounce before that decline is made.
Supporting such a potential correction is the Descending Trend Channel itself that suggests silver will probably find support at its bottom trendline between $22 and $24 per ounce and this should be seen as a very real possibility unless silver climbs above about $40 per ounce.
Perhaps the impetus for this potential plunge in silver will be next week’s FOMC meeting when it will probably be reiterated that there will not be a QE3 in the near future unless clear signs of deflation were to become apparent in the form of a stock market correction and/or a narrowing spread between Treasurys and TIPS.
In turn, such possible messaging might shake all of speculative precious metal bugs out of what has been a very rewarding tree at times to leave behind the hard core metals people for gold appears ready for its third corrective phase as well even though the past timing particulars are different.
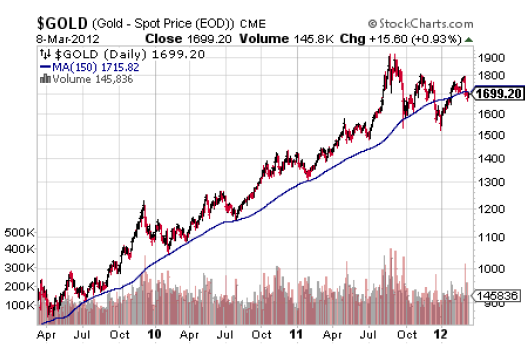
Pointing to this potential decline in gold is the fact that gold is back below its very important and historically very supportive 150 DMA and this sets the backdrop for gold to trade down and perhaps significantly so.
A quick glance at the chart above suggests gold will trade down below $1,500 per ounce for a potential decline of 10-15% and this possibility is supported by the weekly chart shown below.
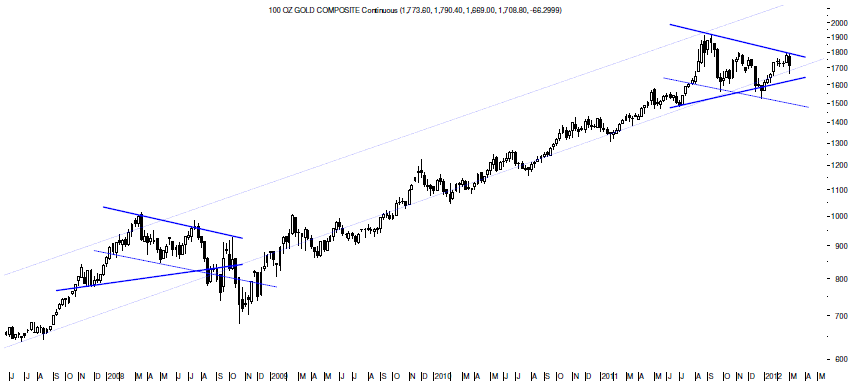
As can be seen, gold is trading in a similar set-up that preceded its correction back in 2008 and that is a Descending Trend Channel and Symmetrical Triangle combo with the Channel calling for a drop down toward its bottom trendline around $1,475 per ounce and the Symmetrical Triangle suggesting the decline could be much deeper toward its minimum target of $1,125 per ounce and a region that offers good long-term support to gold.
This sort of an extreme decline should be taken seriously, too, unless gold rises above $1,812 per ounce or so.
Should the Symmetrical Triangle in gold win out, it equals a potential decline of 34% from current levels and a bit more in-line with the type of drop that may take shape in silver and it is for this sort of possible correction in gold and silver that provides good reason to believe that a precious metals plunge part III may be about to take place.
Sam’s Stash, Gold and the S&P
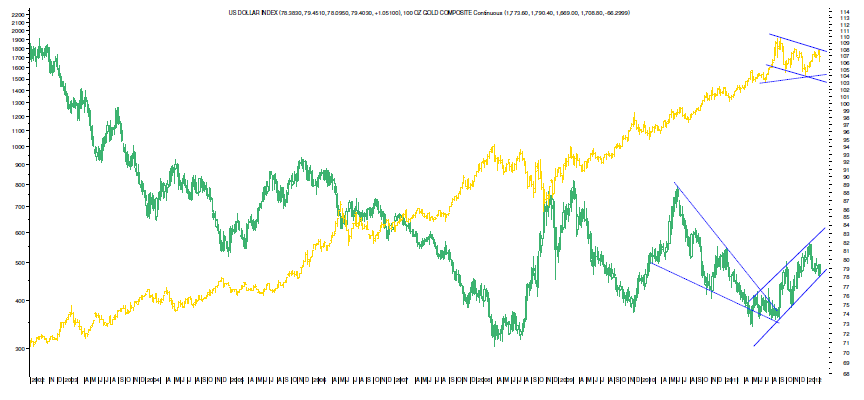
Not surprisingly, gold’s Descending Trend Channel of recent months is a shorter inverse of the Ascending Trend Channel in the dollar with gold’s Symmetrical Triangle suggesting that gold and the dollar may begin to trade toward each other again in the context of this long-term weekly chart.
Driving the dollar index up potentially is that Falling Wedge that’s been a favorite topic here for at least a year with everything taking longer and going much further than ever seemed civilized initially, but it has been driving the dollar quietly toward its target of 88 and this pattern suggests that not only will there not be a QE3 announced next week as is pretty much known but that such an announcement is months off.
In turn, the more speculative gold bugs, the non-gold, guns and God gold bugs, will likely be shaken from the great golden giving tree leaving the more hard core sort behind.
What makes this possibility most interesting, however, even though it would not show itself for years most likely is a long-term trend reversal in gold and the dollar with gold appearing vulnerable to a reversal to the downside and the dollar looking ready to try to reverse its long-term downtrend.
Overall, then, the chart of gold and the dollar together supports the possibility of some sort plunge in the precious metals to come.
- English (UK)
- English (India)
- English (Canada)
- English (Australia)
- English (South Africa)
- English (Philippines)
- English (Nigeria)
- Deutsch
- Español (España)
- Español (México)
- Français
- Italiano
- Nederlands
- Português (Portugal)
- Polski
- Português (Brasil)
- Русский
- Türkçe
- العربية
- Ελληνικά
- Svenska
- Suomi
- עברית
- 日本語
- 한국어
- 简体中文
- 繁體中文
- Bahasa Indonesia
- Bahasa Melayu
- ไทย
- Tiếng Việt
- हिंदी
Precious Metals Plunge Part III?
Published 03/10/2012, 11:33 PM
Updated 07/09/2023, 06:31 AM
Precious Metals Plunge Part III?
3rd party Ad. Not an offer or recommendation by Investing.com. See disclosure here or
remove ads
.
Latest comments
Great article and use of technical tools. Your thesis is very much in line with my own. While its hard to be the bear in the crowd of bulls, the steadfast with proper risk measures will prevail.
Yes I agree on all of issues , beautiful technical and fundamental explanation..
Install Our App
Risk Disclosure: Trading in financial instruments and/or cryptocurrencies involves high risks including the risk of losing some, or all, of your investment amount, and may not be suitable for all investors. Prices of cryptocurrencies are extremely volatile and may be affected by external factors such as financial, regulatory or political events. Trading on margin increases the financial risks.
Before deciding to trade in financial instrument or cryptocurrencies you should be fully informed of the risks and costs associated with trading the financial markets, carefully consider your investment objectives, level of experience, and risk appetite, and seek professional advice where needed.
Fusion Media would like to remind you that the data contained in this website is not necessarily real-time nor accurate. The data and prices on the website are not necessarily provided by any market or exchange, but may be provided by market makers, and so prices may not be accurate and may differ from the actual price at any given market, meaning prices are indicative and not appropriate for trading purposes. Fusion Media and any provider of the data contained in this website will not accept liability for any loss or damage as a result of your trading, or your reliance on the information contained within this website.
It is prohibited to use, store, reproduce, display, modify, transmit or distribute the data contained in this website without the explicit prior written permission of Fusion Media and/or the data provider. All intellectual property rights are reserved by the providers and/or the exchange providing the data contained in this website.
Fusion Media may be compensated by the advertisers that appear on the website, based on your interaction with the advertisements or advertisers.
© 2007-2024 - Fusion Media Limited. All Rights Reserved.
