
US and Asian indices slid after a report said that US President-elect Joe Biden is expected to unveil a USD 1.9trln spending package. The more-than-expected rise in initial jobless claims may have also hurt market sentiment. Among the G10 currencies, the British pound was the main gainer, reacting very little to today’s disappointing GDP and industrial production data.
US And Asian Equities Retreat, Pound Shrugs Off Weak Data
The US dollar traded mixed against the other G10 currencies on Thursday and during the Asian session Friday. It gained against NOK, CHF, and EUR in that order, while it underperformed the most versus GBP, SEK, and CAD. The greenback was found virtually unchanged against NZD.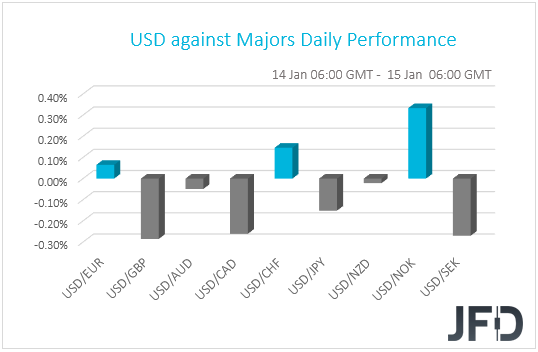
The weakening of the Swiss franc and the strengthening of the Canadian dollar suggest that markets traded in a risk-on manner. However, the relative strength of the Japanese yen points otherwise. Thus, in order to get a clearer picture with regards to the broader market appetite, we prefer to take a look at the performance of the equites. Major EU indices rose for the third straight session, perhaps due to hopes of a large stimulus package in the US under Biden’s Presidency, as well as due to upbeat Chinese trade data, suggesting that the world’s second largest economy is performing relatively well at a time when covid infections continue to spread fast around the globe. The exception was Italy’s FTSE MIB, which slid 0.47% after premier Matteo Renzi withdrew his party from the ruling coalition, sinking the government on disagreements over funding, and raising the likelihood of early elections.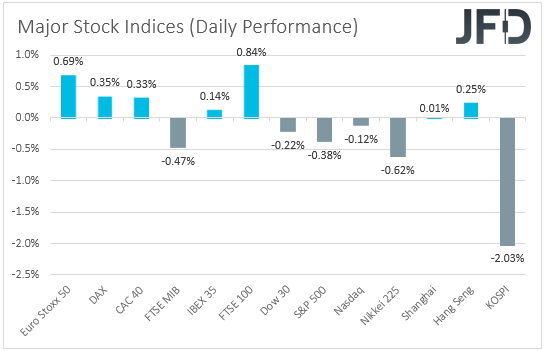
In the US, all three of Wall Street’s main indices closed in negative territory, with the negative sentiment rolling somewhat into the Asian session today. After cheering the prospect of a large stimulus plan in the US by President-elect Biden, investors may have decided to lock some profits following a report that Biden is expected to unveil a USD 1.9trln spending package. The fact that initial jobless claims rose by more than anticipated last week may have also hurt market sentiment, as following the tumble in the NFPs for December, it suggests that the labor market may have taken the down road again. It could also be that investors reduced their risk exposure ahead of the earnings season, set to start today with results from JPMorgan (NYSE:JPM) JP Morgan, Citigroup (NYSE:C) and Wells Fargo (NYSE:WFC).
As for our view, it has not changed, despite the setback in stock markets. We believe that a USD 1.9trln spending package is large enough to provide support for the US economy. The retreat on the report may have just been a “sell the news” market reaction. On top of that, the weakening labor market increases the chances for the Fed to take additional easing steps in the months to come. Remember that the minutes from the latest FOMC gathering revealed that some members noted that they could consider further adjustments to their QE purchases, such as increasing the pace of purchases, or weighting them towards longer maturities. Yes, other members said that once progress towards their goals had been attained, a gradual tapering could begin. However, on Wednesday, several officials pushed back the idea of tapering, with Fed Chair Powell delivering similar remarks yesterday. Thus, we stick to our guns that the vaccinations, the US spending package, the monetary-policy support around the globe, and a softer stance on global trade by Biden, are a cocktail of developments that may keep the broader appetite supported in the first months of 2021.
Now, back to the currencies, the pound was the main gainer among the G10 currencies, reacting very little to the disappointing GDP and industrial production data for November. As we already noted on Monday, bad numbers were not a surprise to us, as November is the period when the UK went back into lockdown. With the Brexit saga now taking the back seat, and BoE Governor playing down the prospect of negative interest rates, the pound has the prospect to perform relatively well. Yes, the disappointing data may increase the chances for the Bank increasing the pace of its QE purchases, but this is something the Bank already noted it stands ready to do. Thus, as soon as this is priced in, if not already, the British pound has the potential to rebound again, at least against the safe havens, like the dollar and the yen, which we expect to stay under selling interest due to a supported overall market sentiment. We understand that talks between the EU and the UK are far from over, as there is still the issue of the UK’s access to the EU’s financial world. However, we will start worrying again as soon as headlines on that front start entering the spotlight.
NASDAQ 100 Technical Outlook
Yesterday, the NADAQ 100 index failed to stay above the psychological 13000 mark and drifted south. The US trading session closed slightly in the negative zone, which could result in further declines today. That said, let’s not forget that, for now, the price is still balancing above a short-term tentative upside line drawn from the low of Dec. 10 and a move a bit lower could be seen as a temporary correction. We will take a cautiously-bullish approach for now.
If the index falls below the 12831 zone, marked by the low of Jan. 13, that could lead NASDAQ 100 further south, possibly aiming for the 12776 obstacle, or the aforementioned upside line. If that whole area manages to provide support, this could result in a rebound, potentially driving the price back to the 12831 hurdle, or the 12929 level. That level marks an intraday swing low of Jan. 14. Slightly above it runs a short-term tentative downside line, which might provide a temporary hold-up.
Alternatively, if the previously-discussed upside line breaks and the price falls below the 12670 zone, marked by an intraday swing high of Jan. 7, that may also place the index below the 200 EMA on our 4-hour chart, this way attracting more sellers. NASDAQ 100 might then drift to the 12600 hurdle, marked by an intraday swing low of Jan. 6, where the price could stall for a bit. However, if the sellers are still feeling a bit more comfortable, they may continue forcing the index to move lower, possibly targeting 12502, or even the 12462 level, marked by the low of Dec. 21.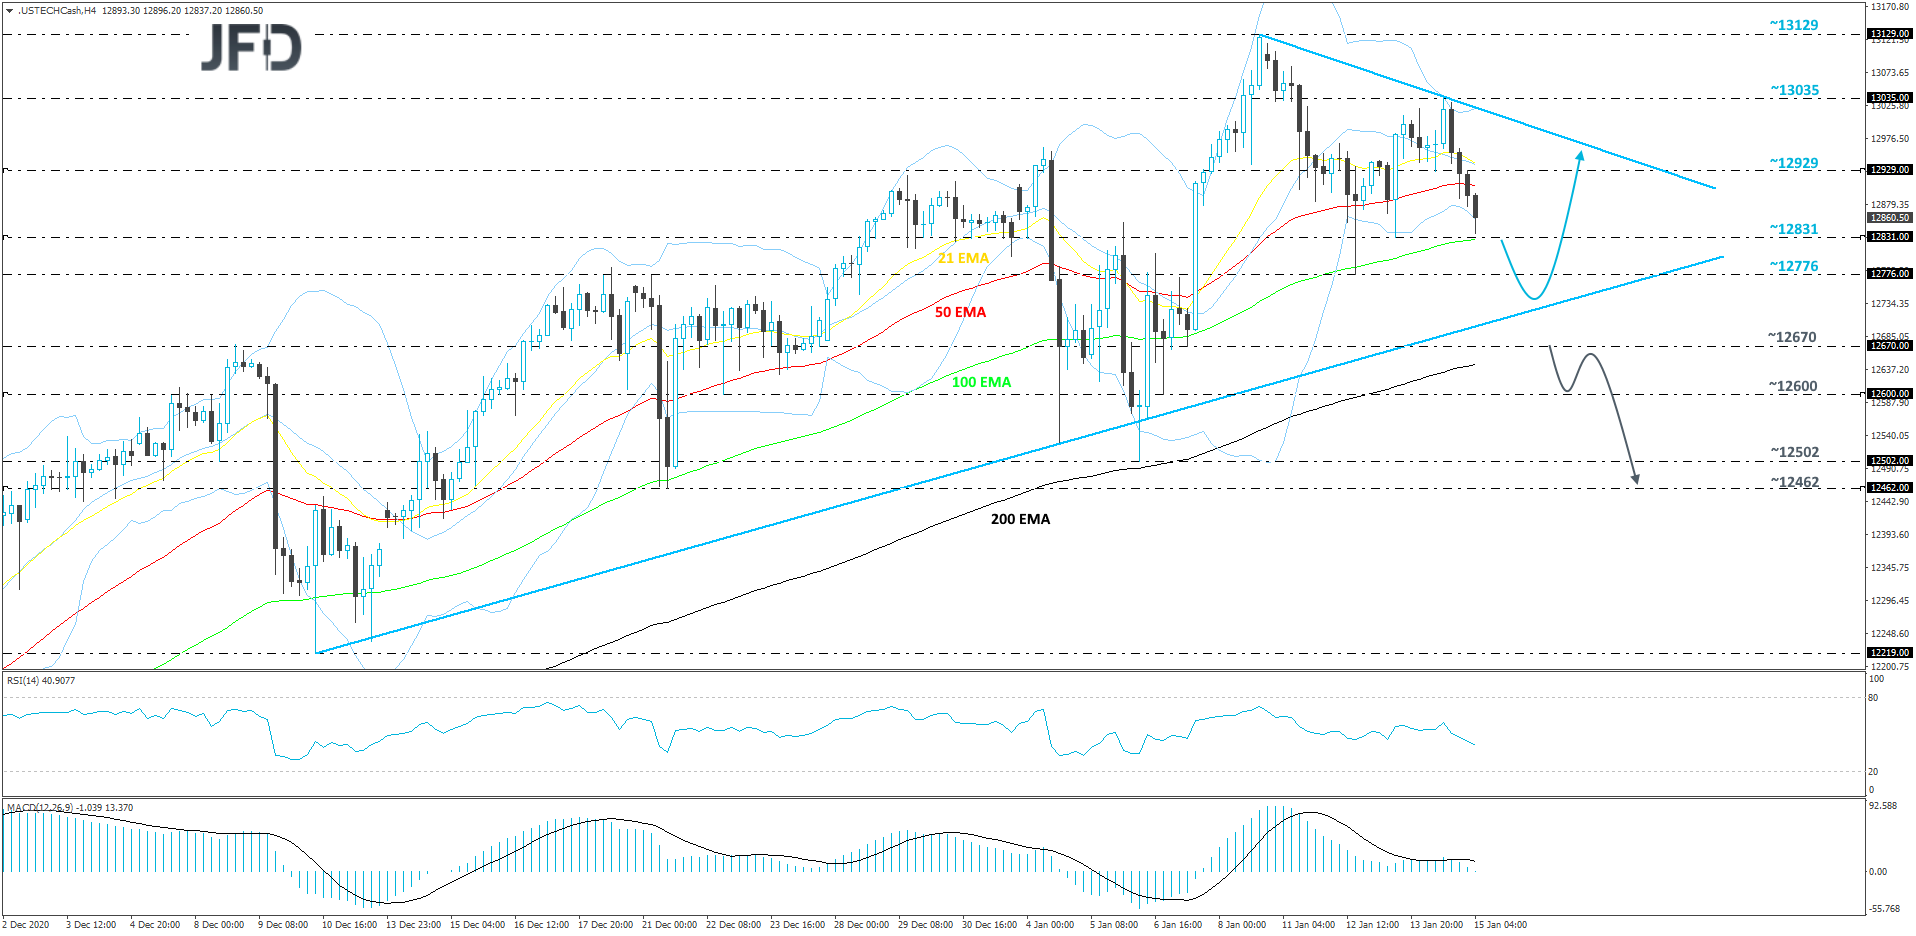
GBP/USD Technical Outlook
Once again, GBP/USD flirted with the area around the 1.3700 hurdle and failed to push further above it. At the time of writing, we can see that the rate is trading slightly below it. At the same time, the pair remains above a short-term upside support line taken from the low of Dec. 21. Although the short-term trend is still to the upside, we would need to wait for a stronger push above the area between the 1.3703 and 1.3710 levels, marked by the high of Jan. 4 and yesterday’s high respectively, in order to get a bit more comfortable with further upside. We will take a somewhat positive approach for now.
If we see the rate jumping above the 1.3710 barrier, this will confirm a forthcoming higher high, possibly opening the door for a move towards some higher areas. We will then aim for the 1.3792 obstacle, a break of which could send the pair to the 1.3840 zone. That zone marks the low of Mar. 12, 2018.
On the other hand, if the previously-mentioned upside line breaks and the rate slides below the 1.3535 hurdle, marked by the high of Jan. 11, that might spook the remaining bulls from the field. GBP/USD may then slide to the 1.3451 area, marked by the current lowest point of January, which could provide temporary support. That said, if the bears continue to dictate the rules, they might send the pair further south, potentially testing the 1.3429 obstacle, or the 1.3367 level, which is an intraday swing high of Dec. 22.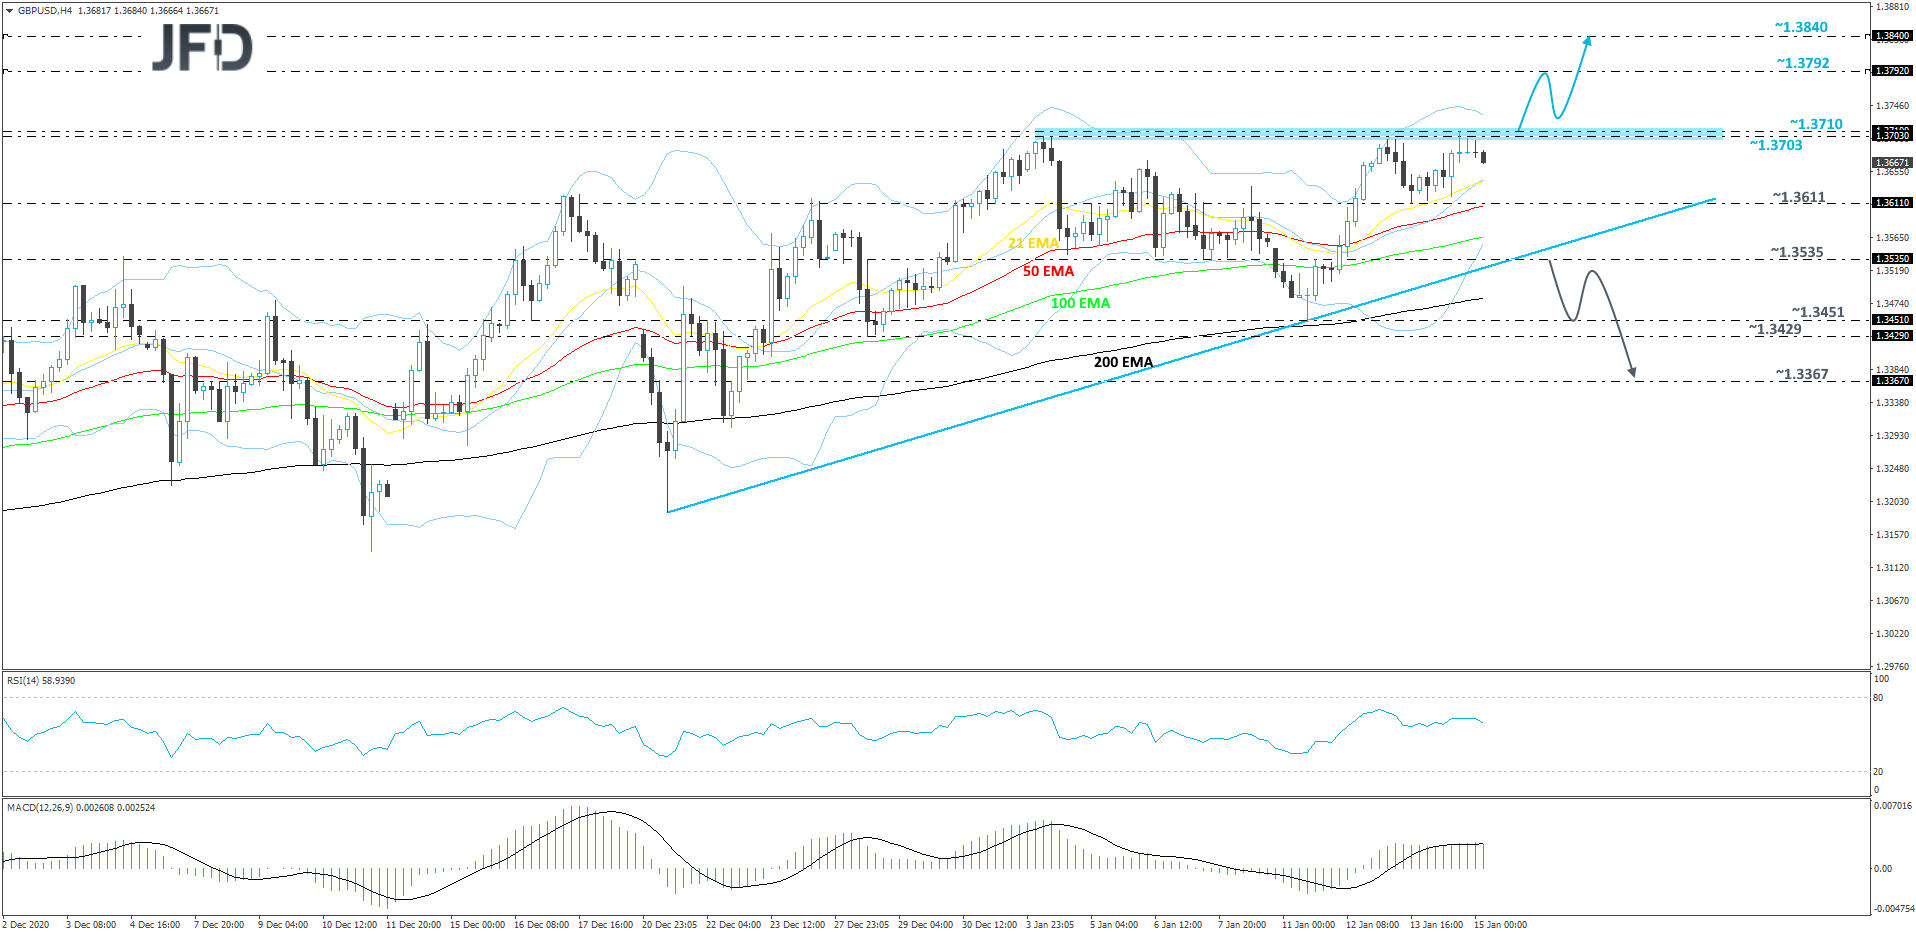
As For The Rest Of Today's Events
Apart from the UK GDP and IP data, which are already out, during the European morning, we also get Eurozone’s trade balance for November, but no forecast is currently available.
From the US, we get the New York Empire State manufacturing index for January, which is forecast to have risen to 6.00 from 4.90, the industrial production for December, which is expected to have grown 0.4% mom, the same pace as in November, and the retail sales for December. Headline sales are forecast to have slid 0.2% mom after falling 1.1% in November, while the core rate is anticipated to have risen to -0.1% mom from -0.9%. The preliminary UoM consumer sentiment index for January is also due to be released and expectations are for a fractional decline, to 80.0 from 80.7.