
With Wall Street closed for Martin Luther King Day, equities around the rest of the world rose yesterday and today in Asia, while safe havens, like the dollar, the yen, and the franc, came under selling interest. With no clear catalyst, we believe that markets traded in the direction of their broader trends. Pound traders are likely to pay some attention to the UK CPIs, due to be released tomorrow, during the early European morning.
Equities And Other Risk Assets Gain, Safe Havens Slide
The US dollar traded lower against all but one of the other G10 currencies on Monday and during the Asian session Tuesday. It lost the most ground against CAD, AUD, SEK and NOK, while it underperformed the least versus CHF. The greenback gained only against JPY.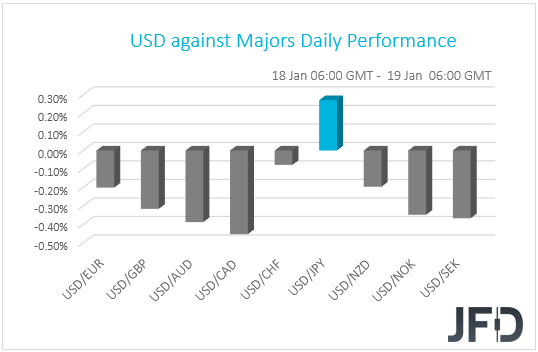
The weakening of the safe-havens dollar, yen and franc, combined with the strengthening of the commodity-linked Loonie and Aussie, suggests that markets traded in a risk-on fashion yesterday and today in Asia. Indeed, turning our gaze to the equity world, we see that major EU indices closed in positive territory, with the only exception being UK’s FTSE 100, which slid 0.22%. Wall Street stayed closed for Martin Luther King Day. Risk appetite was boosted even more during the Asian trading today. Although China’s Shanghai Composite fell 0.83%, Japan’s Nikkei 225, Hong Kong’s Hang Seng and South Korea’s KOSPI gained 1.39%, 1.96% and 2.61% respectively.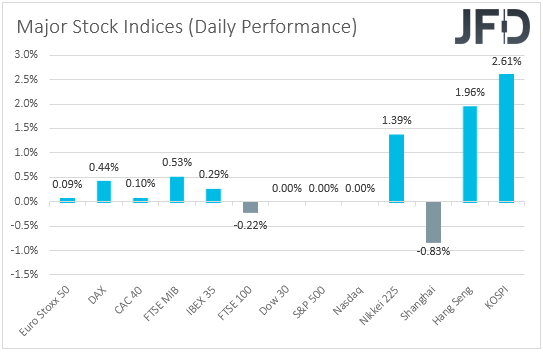
With no clear catalyst behind the moves, we believe that markets traded in the direction of their broader trends. All this is in tandem with our broader view. It’s been some time now that we’ve been calling for higher equities and other risk-linked assets. We stick to our guns that the vaccinations, the fiscal stimulus in the US, the monetary-policy support around the world, and a softer stance on trade by Biden, are a cocktail of developments which is likely to keep risk appetite supported in the first months of 2021.
Having said that though, we believe that investors will adopt a more cautious stance today and tomorrow ahead of Joseph Biden’s inauguration as the 46th US President. Usually, such events pass unnoticed by the markets, as the election outcome and who will be the next President is already known. However, this time, there is the risk for Trump’s supporters to proceed with more violent protests, as they still refuse to accept that the outcome of the elections was fair and clear. In such a case, a risk-off wave may be possible, resulting in corrective moves in most markets.
NASDAQ 100 Technical Outlook
The technical picture of the NASDAQ 100 cash index on our 4-hour chart shows that this morning, the price moved strongly to the upside, after yesterday’s reversal from the short-term upside support line taken from the low of Dec. 10. However, the index is still trading below a short-term tentative downside line, drawn from the high of Jan. 8, which is currently halting the further upmove. However, given NASDAQ’s proximity to that downside line, and also taking into account the broader trend is to the upside, there is a chance to see a break of that downside line.
If, eventually, the price pops above that downside line, more buyers could join in, which may help lead the index towards the 13035 zone, marked by the high of Jan. 14. NASDAQ 100 might stall there temporarily, but if the bulls are still feeling confident, they could end up pushing the price towards the all-time high, at 13129.
In order to aim for some lower areas, we would need to wait for a violation of the previously-discussed upside line and then a price-drop below yesterday’s low, at 12737. This way, more sellers could join in, as such a move would confirm a forthcoming lower low. NASDAQ may then drift to the 12670 obstacle, coinciding with the 200 EMA on our 4-hour chart, a break of which might clear the way to the 12600 level. That level marks an intraday swing low of Jan. 6.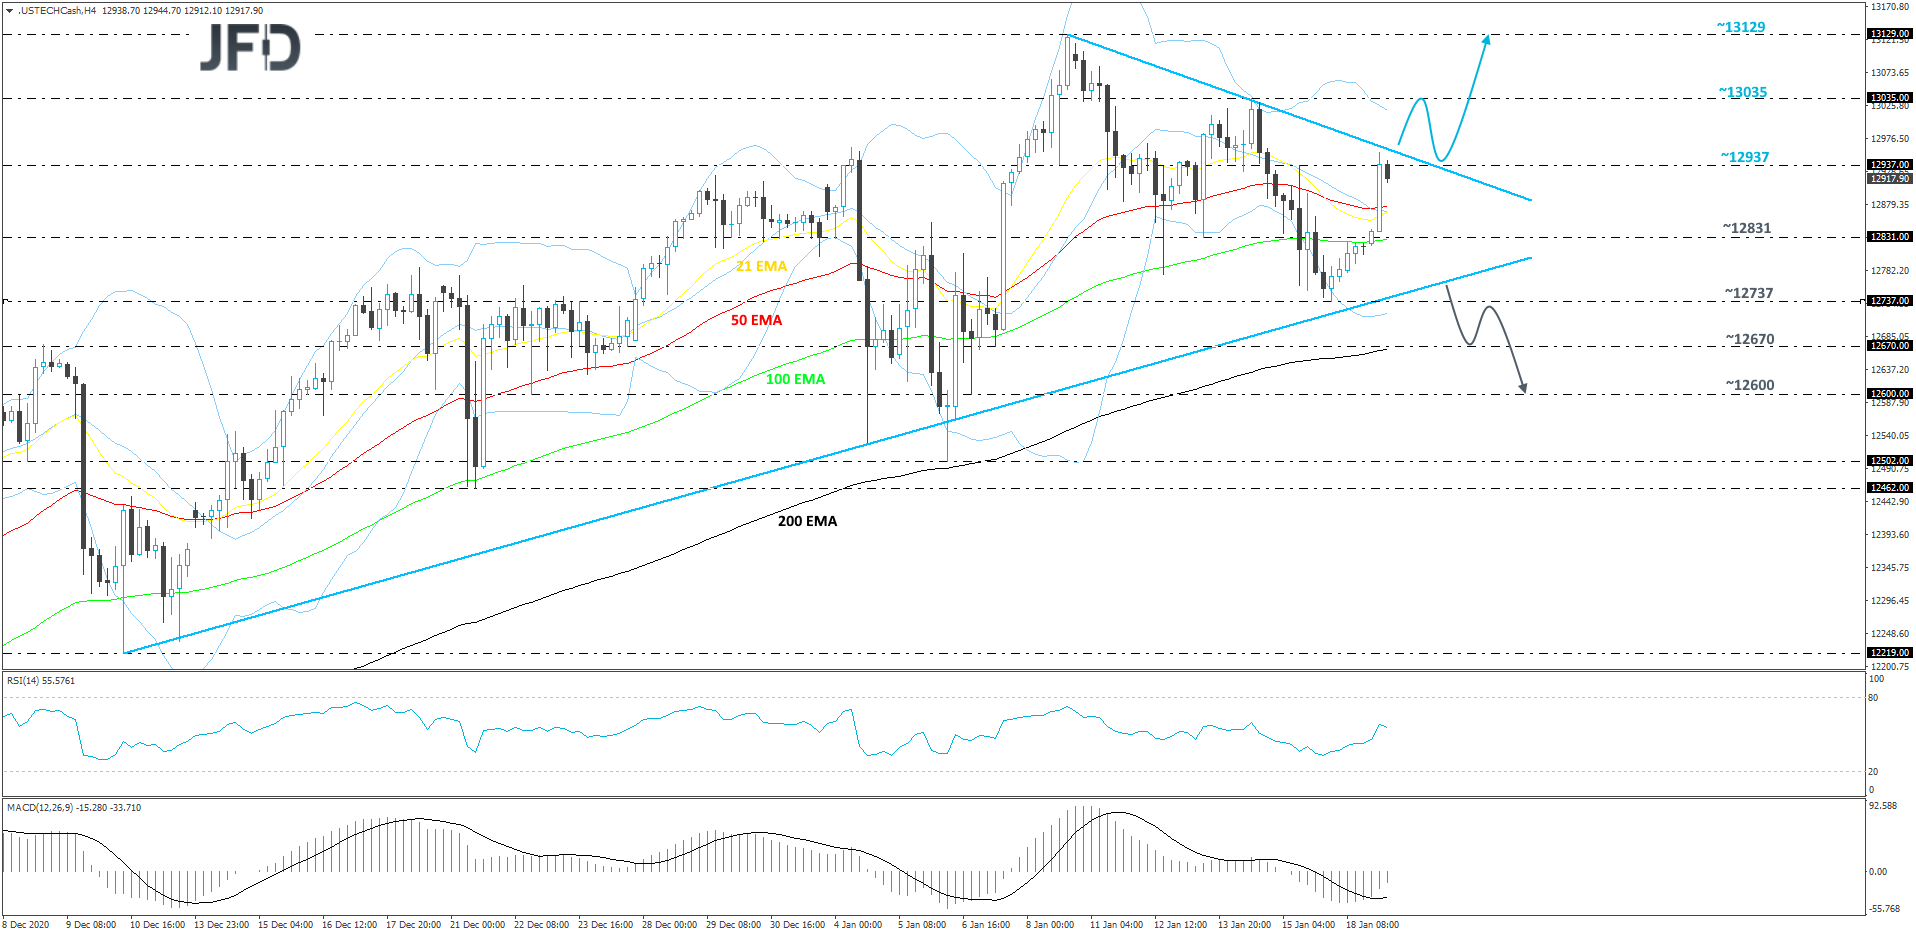
UK CPIs On Tomorrow's Early European Agenda
Back to the currencies, pound traders are likely to pay some attention to the UK CPIs for December which are scheduled to be released tomorrow during the early European morning. Both the headline and core rates are expected to have risen to +0.5% yoy and +1.3% yoy from +0.3% and +1.1% respectively. Although this is a move in the desired direction, both rates are still decently below the BoE’s target of 2%, and thus, the prospect of the Bank increasing the pace of its QE purchases at some point soon is not off the table. In any case, this is something the Bank already noted that it stands ready to do. Thus, it will not come as a major surprise if it happens.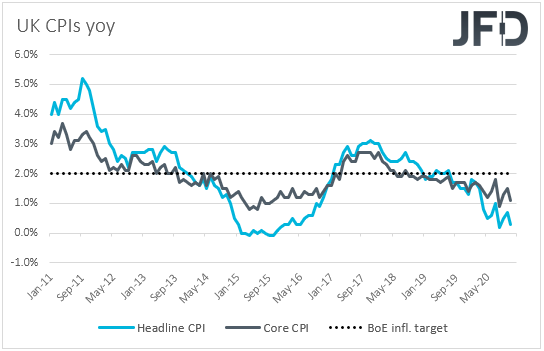
Overall, with the Brexit saga now taking the back seat, and BoE Governor playing down the prospect of negative interest rates, the pound has the potential to perform relatively well, at least against the safe havens, like the dollar and the yen, which we expect to stay under selling interest due to a supported overall market sentiment. We understand that talks between the EU and the UK are far from over, as there is still the issue of the UK’s access to the EU’s financial world. However, we will start worrying again as soon as headlines on that front start entering the spotlight.
GBP/USDTechnical Outlook
Yesterday, after a brief drop below its short-term upside support line, drawn from the low of Dec. 21, GBP/USD reversed sharply back up. The pair is now near one of its resistance areas, at 1.3615, marked by the low of Jan. 14. Given that the rate travelled back above that upside line, we will take a positive approach, at least for now.
If the pair climbs back above the 1.3615 zone, that may help more buyers to make up their minds and join in. GBP/USD could then rise to the 1.3658 obstacle, a break of which might clear the path to the next possible resistance area between the 1.3703 and 1.3710 levels. Those levels mark the highs of Jan. 4 and 14 respectively.
Alternatively, if the pair falls back below the aforementioned upside line and moves below yesterday’s low, at 1.3520, that will confirm a forthcoming lower low, potentially sending the rate further south. GBP/USD could then drift to the 1.3451 area, marked by the current lowest point of January. If the selling doesn’t end there, the pair might easily slide to the 1.3429 hurdle, or to the 1.3367 level, which is an intraday swing high of Dec. 22.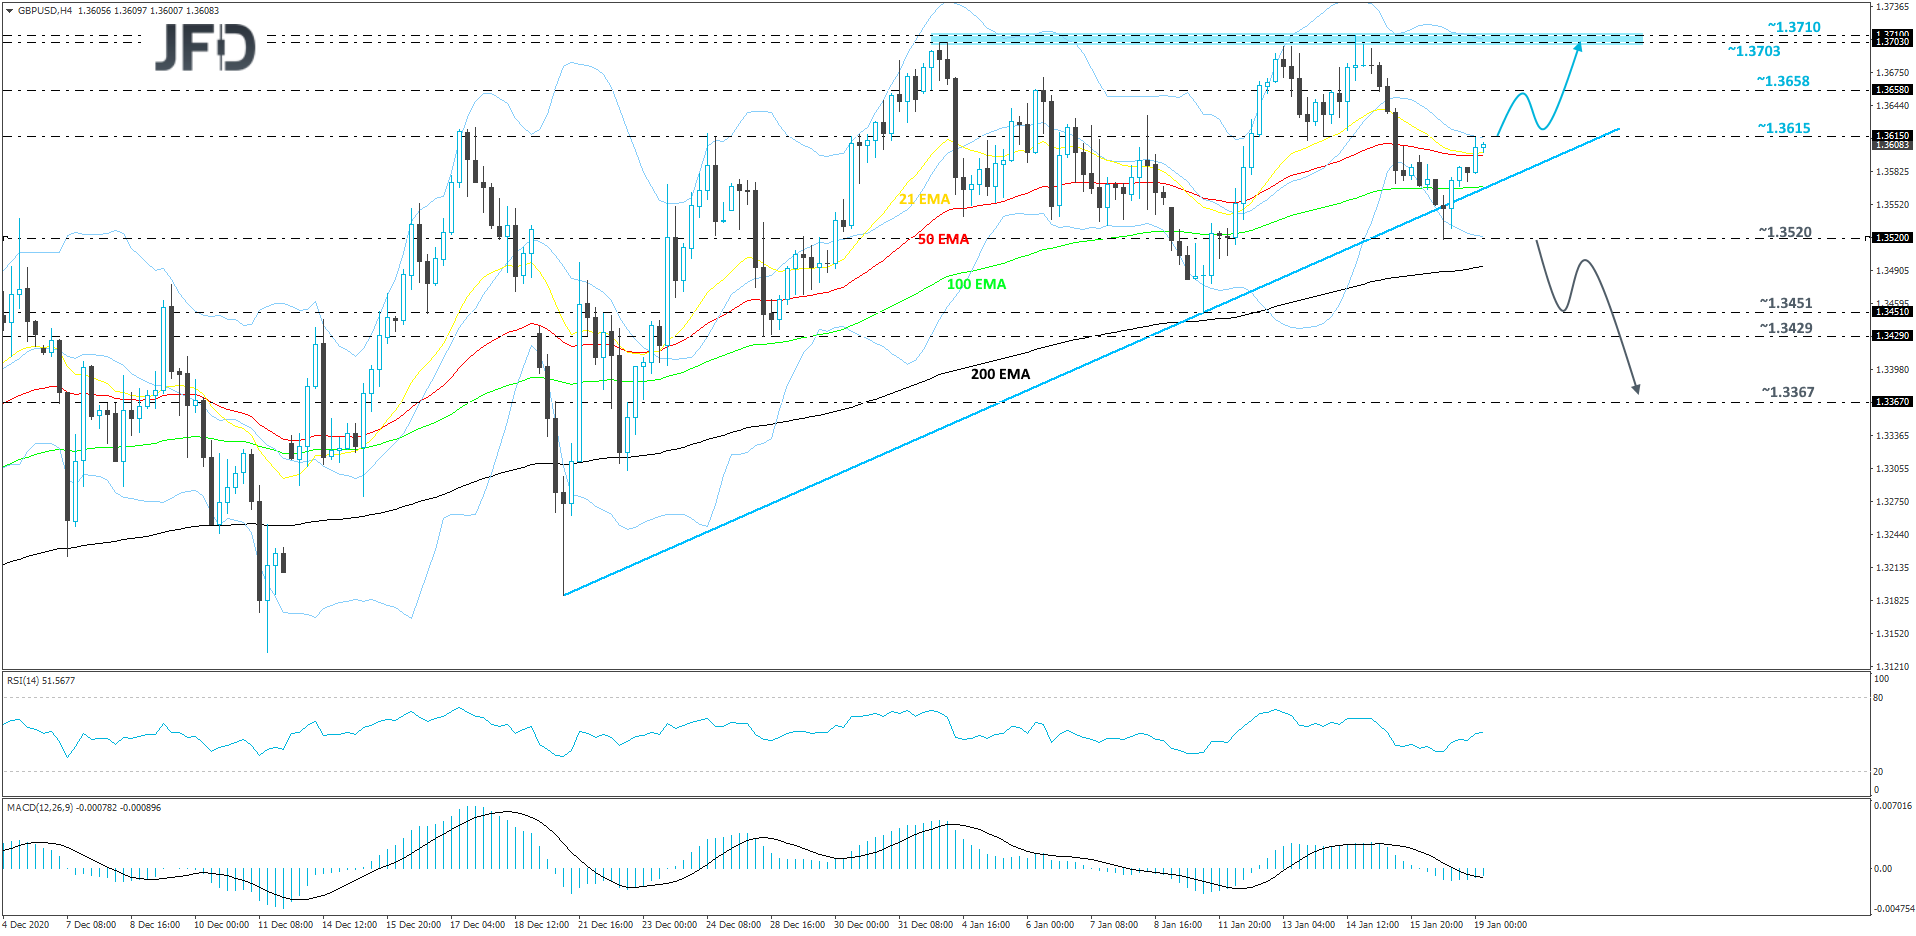
As For Today's Events
During the European session, the final German CPIs for December, the nation’s ZEW survey for January, and Eurozone’s current account balance for November are due to be released. As it is always the case, the final German CPIs are forecast to confirm their preliminary estimates, while, with regards to the ZEW survey, the current conditions index is anticipated to have declined to -68.0 from -66.5, but the economic sentiment one is expected to have risen to 60.0 from 55.0. There is no forecast for Eurozone’s current account balance.
Later in the day, we get Canada’s manufacturing sales for November, which are expected to have slid 0.1% mom after rising 0.3% in October.
We also have a speaker on today’s agenda and this is BoE Chief Economist Andy Haldane.