Here are the latest developments in global markets:
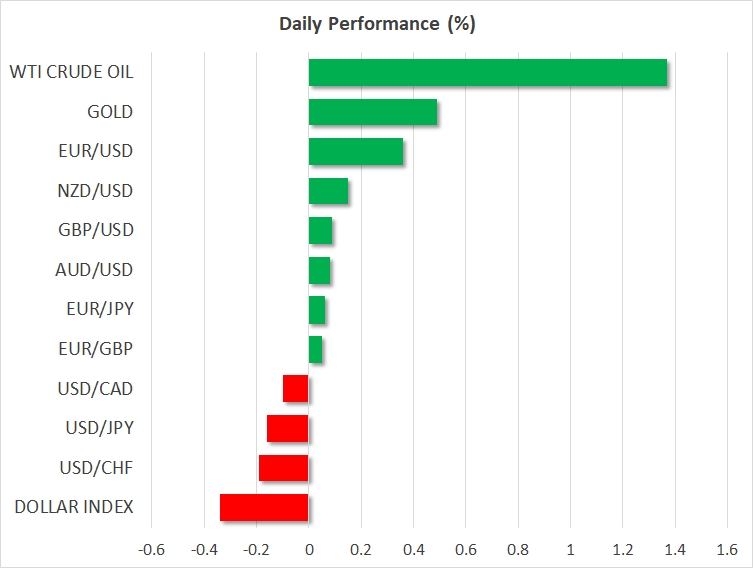
· FOREX: The dollar index traded 0.3% lower on Monday, despite the recent surge in 10-Year US Treasury yields, which are now hovering near 2.88%.
· STOCKS: US equity indices experienced a tentative rebound on Friday. The S&P 500 led the way, rising by 1.5%, while the Dow Jones and the Nasdaq Composite rose by 1.4%. Moreover, futures tracking the S&P, Dow, andNasdaq are all in positive territory at the moment, suggesting that these indices could open in the green today. That said, the turbulence may not be over just yet, as there are a couple of major events in the bond market this week that could have spillover effects to stocks as well. Japanese markets were closed today for a holiday. Hong Kong’s Hang Seng was down by less than 0.2%, giving up on earlier gains, while the rest of Asia was up for the most part. In Europe, futures tracking the Euro Stoxx 50 are safely in the green.
· COMMODITIES: Oil prices briefly tumbled on Friday, after the Baker Hughes oil rig count showed that the number of active US rigs surged. The pullback only lasted a few hours though, before oil prices recovered alongside the major US equity indices and energy stocks. WTI crude is up nearly 1.4% today, while Brent is 1.0% higher. Despite the rebound, one must sound a note of caution that US production has risen rapidly in recent weeks, putting in jeopardy the narrative that the market is rebalancing itself quickly, and increasing the risk of further tumble should this pattern continue. In precious metals, gold prices are 0.3% higher today, possibly due to the softer greenback. Strangely, the yellow metal has remained largely indifferent to equity market volatility in the past week.
Major movers: Stocks rebound; US budget deficit in focus
Friday was a particularly busy day in financial markets. The spotlight remained on major US equity indices, which recovered some of their recent losses, but still posted their worst week in around two years. Following last week’s selloff, investors may be wondering how much longer the turbulence will last, and whether it will get even worse before it gets better. That question may be partially answered on Wednesday, when the US releases its inflation data for January. Should the CPIs confirm that inflationary pressures have started to intensify, as was indicated by the pick-up in earnings, then US Treasury yields could spike higher and thus exert greater downward pressure on equities. Conversely, soft inflation prints could provide some much-needed reprieve to stock indices.
Another factor that could impact US bond yields and thereby equity performance is the government’s budget deficit announcement for 2019, which is due today. On Sunday, US Budget Director Mick Mulvaney said that the US will post a larger deficit this year, something that could result in a “spike” in interest rates. Should his statement come true, equity indices will probably continue to be on shaky legs for a while longer.
Sterling tumbled on Friday, as the EU’s chief Brexit negotiator Michel Barnier provided a reality check on the progress of the negotiations. Among other points, he noted that there are still substantial disagreements regarding the transition period, and that a transition deal is not a given should these disputes persist. His comments underline once again that there is little room for complacency in this process, and that even a “simple” matter like a transition period should not be viewed as a “done deal” beforehand by investors.
Elsewhere, the Canadian dollar experienced heightened volatility on Friday, following the nation’s jobs report for February. The currency initially tumbled, as the unemployment rate rose by more than expected and the labor force participation rate fell. However, the loonie rebounded almost immediately to trade even higher against the dollar, perhaps because investors focused on the encouraging aspect of the report; wages. Earnings accelerated notably, a factor that may have led to speculation the BoC may “look through” some of the softness in jobs, amid signs that inflationary pressures are picking up.
In Japan, media outlets reported that Bank of Japan (BoJ) Governor Haruhiko Kuroda will be nominated for another term. A confirmation of this by Parliament could help to cement expectations that the BoJ will keep its ultra-loose policy framework in place for an extended period of time.
Day ahead: Equities could dominate attention in absence of data
Monday’s calendar is a light one, with the focus possibly remaining in equity markets after the previous week’s turmoil. Companies releasing earnings will also be attracting interest.
Data on the US’s Federal Budget balance for the month of January will be made public at 1900 GMT.
Bank of England policymakers Gertjan Vlieghe and Ian McCafferty will be speaking at 0950 GMT and 1630 GMT respectively, while Reserve Bank of Australia Assistant Governor Luci Ellis will be talking at a forecasting conference at 2150 GMT.
On the political front, it seems that there are renewed efforts to further ease tensions in the Korean peninsula, as the 2018 Winter Olympics are taking place in South Korea; the event seems to have brought North and South Korea closer together.
In oil markets, OPEC’s monthly report is due later on Monday. The survey covers issues affecting oil markets, touching on supply and demand and providing an outlook for the coming year. The release in tentative though, without a specific time of release.
Technical Analysis: Gold moves further above 1-month low; bullish signal by stochastics in very short-term
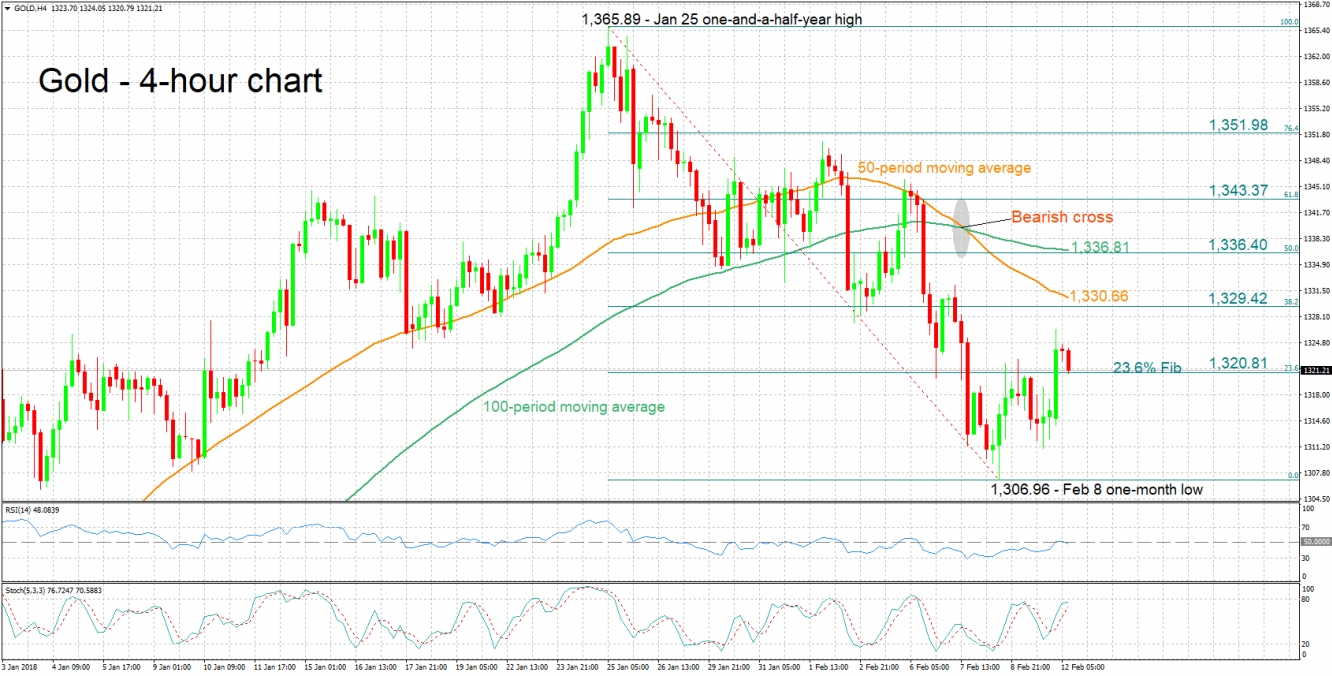
Gold has advanced somewhat after hitting a one-month low of 1,306.96 on February 8.
The RSI started rising after hitting oversold levels on the four-hour chart, potentially signaling a change in momentum in the short-term. The stochastics are giving a bullish signal in the very-short-term: the %K line has crossed above the slow %D one and both lines are heading higher.
A catalyst driving the US currency higher is anticipated to lead to weakness in the dollar-denominated precious metal, with the area around the 23.6% Fibonacci retracement level of the January 25 to February 8 downleg at 1,320.81 potentially acting as immediate support. Price action is at the moment taking place not far above the 23.6% Fibonacci, which was monetarily violated. Further below, the focus would shift to last week’s one-month low of 1,306.96.
A weaker greenback on the other hand, could lend support to gold. In this case, resistance might come around the 38.2% Fibonacci at 1,329.42 – the area around this level also encapsulates the 50-period moving average at 1,330.66.


