Last week I detailed an ETF portfolio intended to mimic PRPFX, the Permanent Portfolio mutual fund. Coincidentally, Global X launched a Permanent ETF (PERM) last week; the fund seeks to provide investment results that correspond generally to the price and yield performance, before fees and expenses, of the Solactive Permanent Index. The Solactive Permanent Index allocates 25% each to four asset class categories: Stocks, U.S. Treasury Bonds (Long-Term), U.S. Treasury Bonds (Short-Term), and Gold and Silver.
The stated allocation of PERM corresponds to Harry Browne’s proposed allocation in his 1998 Fail-Safe Investing: Lifelong Financial Security in 30 Minutes. Browne proposed an equal-weight portfolio of stocks, long-term bonds, cash, and gold.
An investor could create this portfolio using as little as four ETFs: SPY (SPDR S&P 500 ETF), TLT (iShares Barclays 20+ Year Treasury), SHY (iShares Barclays 1-3 Year Treasury Bond Fund), and GLD (SPDR Gold Trust). These are not the only ETFs which could be used to replicate Browne’s Permanent Portfolio. For example, VTI (Vanguard Total Stock Market ETF) is a viable substitute for SPY and offers exposure to stocks in the small and medium market cap space.
How has Browne’s portfolio performed historically? There are several sources which track the strategy, with some minor variations between the different indexes or trading vehicles used to track performance. Crawling Road has tracked the annual performance from 1972 through 2011.
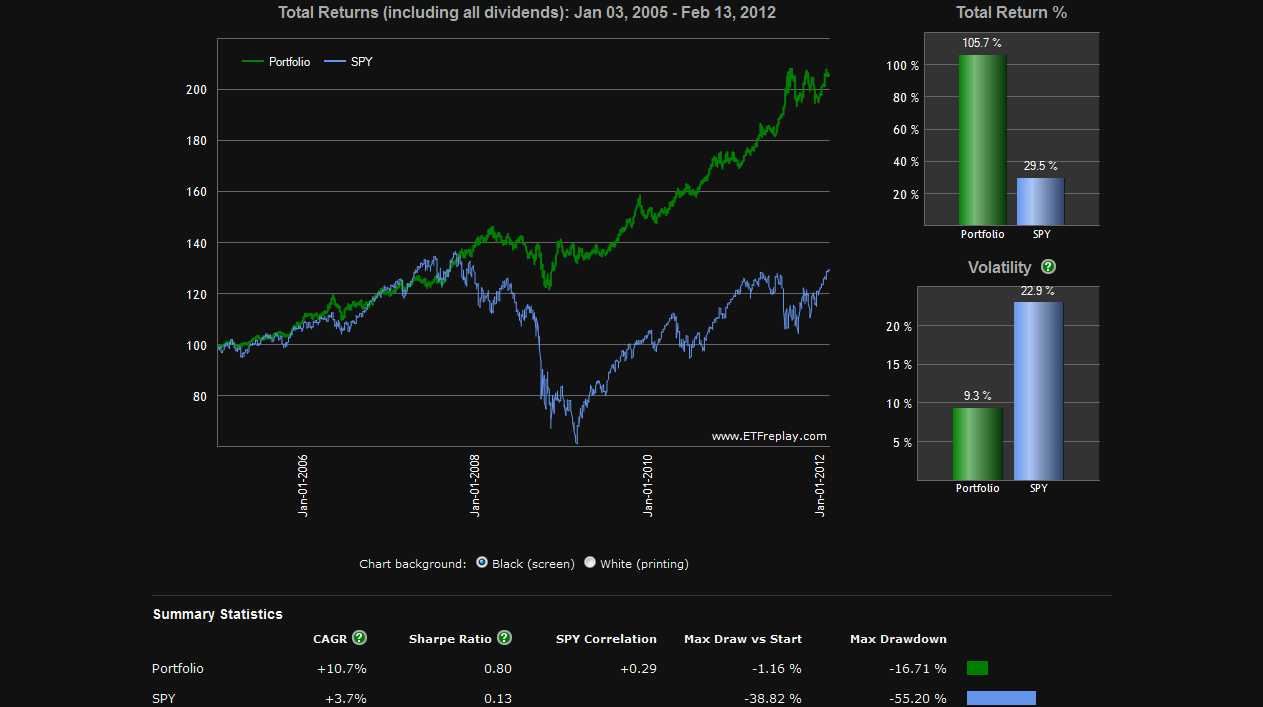
I created an ETF portfolio of SPY, TLT, SHY, and GLD. Using ETF Replay I then tested the portfolio as a buy and hold portfolio from January 3, 2005 until February 13, 2012. GLD did not begin trading until November 2004, which restricts our test using ETFs. The results of the test are below:
The portfolio had a total return including dividends of 105.7% (10.7% compound annual growth rate) with volatility of 9.3%. The max drawdown was 16.71% and the sharpe ratio .80.
How has a simple 10 month moving average system performed within this portfolio? The 10 month simple moving average system has been popularized in recent years by Mebane Faber in The Ivy Portfolio: How to Invest Like the Top Endowments and Avoid Bear Markets. When an ETF in the portfolio was below its 10 month moving average at month-end, the position was sold and held in “cash” (SHY was used as a substitute for cash). When it closed the month above its 10 month moving average, the ETF was purchased at the stated allocation.
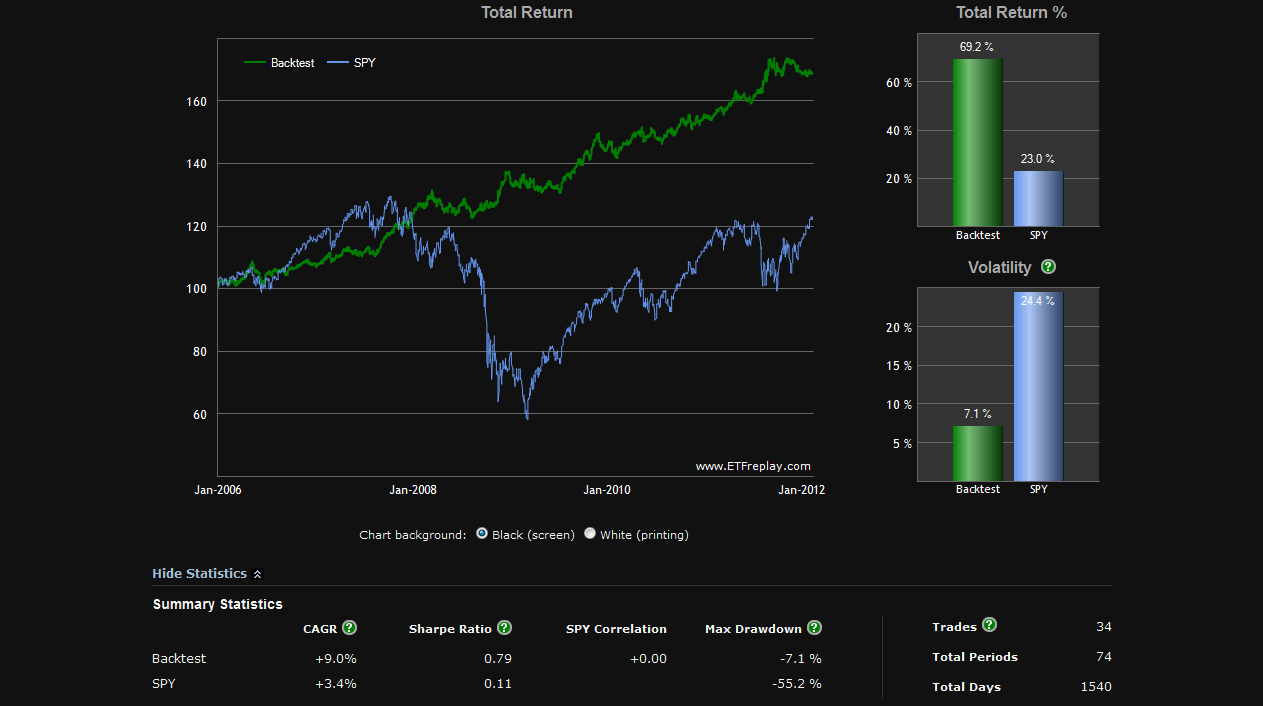
The performance for the 10 month moving average system within the 4 ETF permanent portfolio is below. The results are from 2006-February 13th, 2012. GLD did not have adequate trading history at the start of 2005 to generate a 10 month moving average, therefore we started in 2006:
The total returns were 69.2% (9% CAGR) with volatility of 7.1%. The max drawdown was 7.1% and the sharpe ratio .79. Keep in mind these statistics include the 2008 period, when global equity markets suffered extreme volatility.
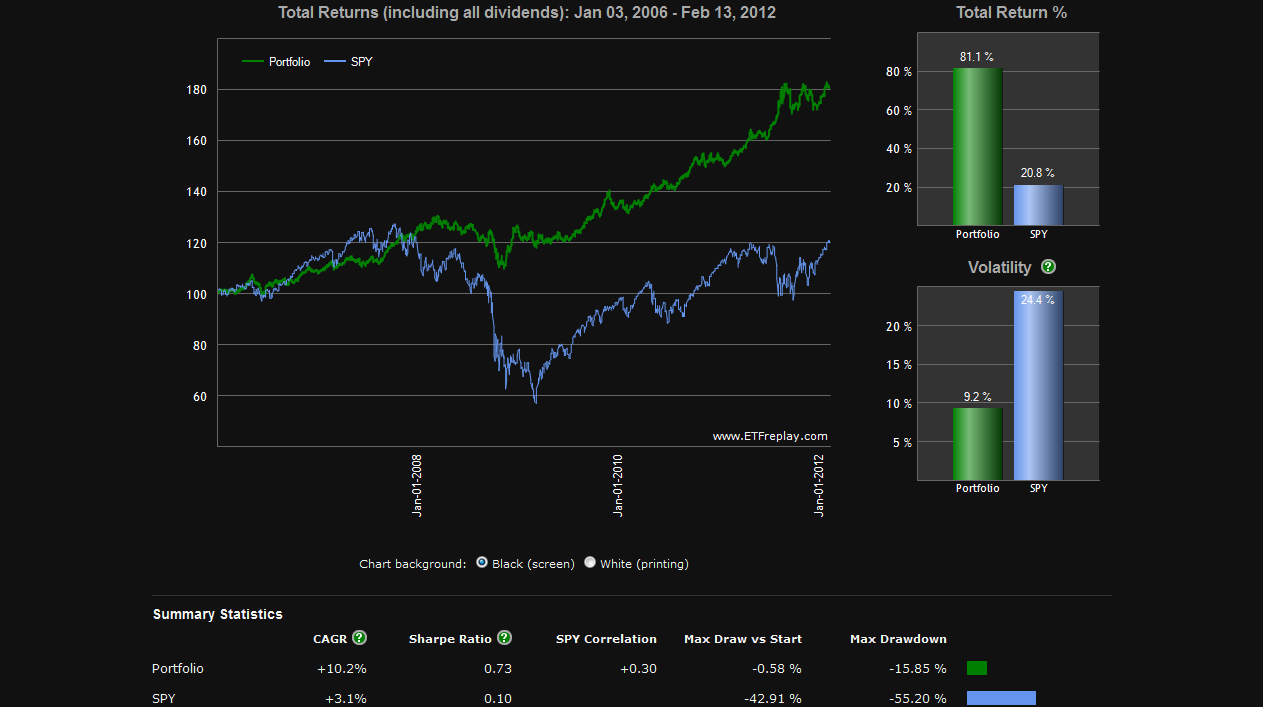
Since the first buy and hold test started in 2005, it is fair to compare the 10 month moving average returns to buying and holding the same portfolio from 2006-February 13th, 2012:
From 2006 to present, buying and holding total returns were 81.1% (10.2% CAGR) with volatility of 9.2%. The max drawdown was 15.85% and the sharpe ratio .73.
In either case, the portfolio has had relatively low drawdown and volatility with recent returns outpacing equity markets. The 10 month moving average system lowered the volatility of the portfolio to 7.1% and drawdown to 7.1% but had slightly lower overall returns than simply buying and holding the portfolio.
- English (UK)
- English (India)
- English (Canada)
- English (Australia)
- English (South Africa)
- English (Philippines)
- English (Nigeria)
- Deutsch
- Español (España)
- Español (México)
- Français
- Italiano
- Nederlands
- Português (Portugal)
- Polski
- Português (Brasil)
- Русский
- Türkçe
- العربية
- Ελληνικά
- Svenska
- Suomi
- עברית
- 日本語
- 한국어
- 简体中文
- 繁體中文
- Bahasa Indonesia
- Bahasa Melayu
- ไทย
- Tiếng Việt
- हिंदी
Testing a Harry Browne Permanent ETF Portfolio
Published 02/14/2012, 12:32 AM
Updated 07/09/2023, 06:31 AM
Testing a Harry Browne Permanent ETF Portfolio
3rd party Ad. Not an offer or recommendation by Investing.com. See disclosure here or
remove ads
.
Latest comments
Install Our App
Risk Disclosure: Trading in financial instruments and/or cryptocurrencies involves high risks including the risk of losing some, or all, of your investment amount, and may not be suitable for all investors. Prices of cryptocurrencies are extremely volatile and may be affected by external factors such as financial, regulatory or political events. Trading on margin increases the financial risks.
Before deciding to trade in financial instrument or cryptocurrencies you should be fully informed of the risks and costs associated with trading the financial markets, carefully consider your investment objectives, level of experience, and risk appetite, and seek professional advice where needed.
Fusion Media would like to remind you that the data contained in this website is not necessarily real-time nor accurate. The data and prices on the website are not necessarily provided by any market or exchange, but may be provided by market makers, and so prices may not be accurate and may differ from the actual price at any given market, meaning prices are indicative and not appropriate for trading purposes. Fusion Media and any provider of the data contained in this website will not accept liability for any loss or damage as a result of your trading, or your reliance on the information contained within this website.
It is prohibited to use, store, reproduce, display, modify, transmit or distribute the data contained in this website without the explicit prior written permission of Fusion Media and/or the data provider. All intellectual property rights are reserved by the providers and/or the exchange providing the data contained in this website.
Fusion Media may be compensated by the advertisers that appear on the website, based on your interaction with the advertisements or advertisers.
© 2007-2024 - Fusion Media Limited. All Rights Reserved.
