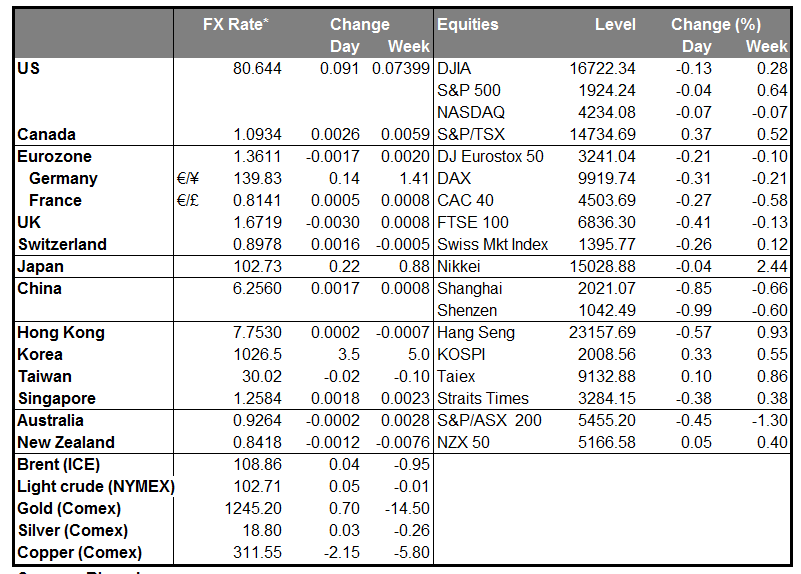
The dollar was unchanged or higher against the other G10 currencies, with the only exception being AUD. The greenback was higher against NZD, JPY, CAD, NOK and GBP, while it was virtually unchanged against SEK, EUR and CHF.
The dollar should be getting some support from higher interest rates. As we mentioned yesterday, Fed Funds rate expectations have been moving up recently. They got another boost overnight from a story in the Wall Street Journal warning that Fed officials are becoming nervous about market complacency, a theme that Fed officials have been warning about. The article pointed out that the futures market is forecasting Fed Funds at 1.6% in December 2016, below the FOMC's own forecast of 2.25%. I expect the market's expectations for US rates to continue to move higher and for that to support the dollar going forward.
The loonie was among the losers, as investors probably positioned ahead of today’s BoC policy meeting. A pick up in April’s CPI has stoked speculation that the Bank could sound less dovish today, but last week’s disappointing growth data erased those expectations. Personally, I would not expect the acceleration in the nation’s inflation to affect the Bank’s stance since last month, Bank of Canada Gov. Poloz said he will dismiss faster inflation this year as temporary, because of slack in the economy. Last month, the Bank also said that a weakening local currency could support the nation’s exports and that company investment will rise gradually in response to growth fed by increased US demand and a weaker Canadian dollar. Since then, the loonie has been the best-performing G10 currency and as a result, the Bank of Canada may try to talk down the currency at this meeting, in my view.
The Australian dollar was the only gainer, after Australia’s GDP accelerated to +1.1% qoq in Q1 from +0.8% qoq, exceeding market expectations of +0.9% qoq.
Today, besides the BoC meeting, we get the final service-sector PMIs for May from the countries we got the manufacturing data for on Monday. The final forecasts from France, Germany and Eurozone, as usual, are the same as the initial estimates, while the UK service-sector PMI is expected to have declined to 58.2 from 58.7. In the US, the final Markit service-sector PMI for May is expected to show a modest decline, while the ISM non-manufacturing index for the month is expected to have risen to 55.5 from 55.2.
In the Eurozone, we also have the 2nd estimate of the bloc’s GDP for Q1. I don’t expect the figure to have an impact, as we have already entered the last month of Q2.
In the US, we have the ADP employment report, two days ahead of the NFP release. The ADP report is expected to show that the private sector gained 210k jobs in May from 220k the previous month, close to the 215k NFP forecast. Remember though that the ADP report is an imperfect predictor of the NFP figure; last month, the ADP was at 220k while the NFP was 288k. The US trade balance for April and the MBA mortgage approvals for the week ended on May 30 are also coming out. Moreover, the Fed releases the Beige book report.
We have only one speaker scheduled on Wednesday. BoE Financial Policy Committee member Richard Sharp speaks at the London School of Economics.
The Market
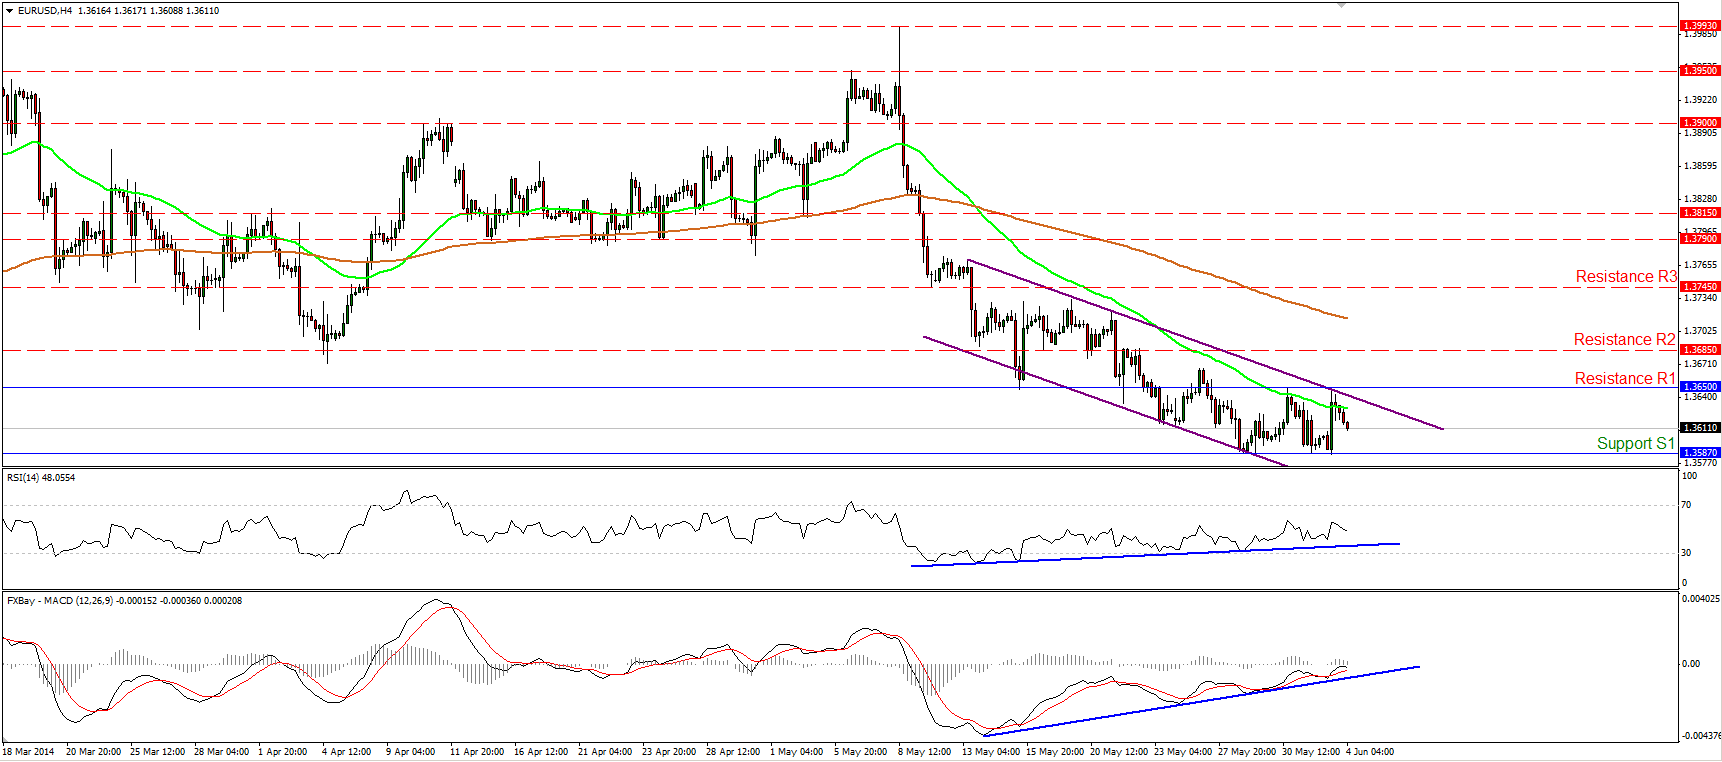
EUR/USD finds resistance at 1.3650
EUR/USD moved higher after finding support at the 1.3587 (S1) barrier, but the advance was halted by the resistance of 1.3650 (R1) and the upper boundary of the purple downward sloping channel. The rate remains within the channel, but since the 28th of May it oscillates between the aforementioned barriers. Also, considering that the positive divergence between our momentum studies and the price action remains in effect, I would adopt a neutral stance for now. A dip below 1.3587 (S1) is needed to signal the continuation of the downtrend, and this could have larger bearish implications, targeting the lows of February at 1.3475 (S2).
• Support: 1.3587 (S1), 1.3475 (S2), 1.3400 (S3).
• Resistance: 1.3650 (R1), 1.3685 (R2), 1.3745 (R3).
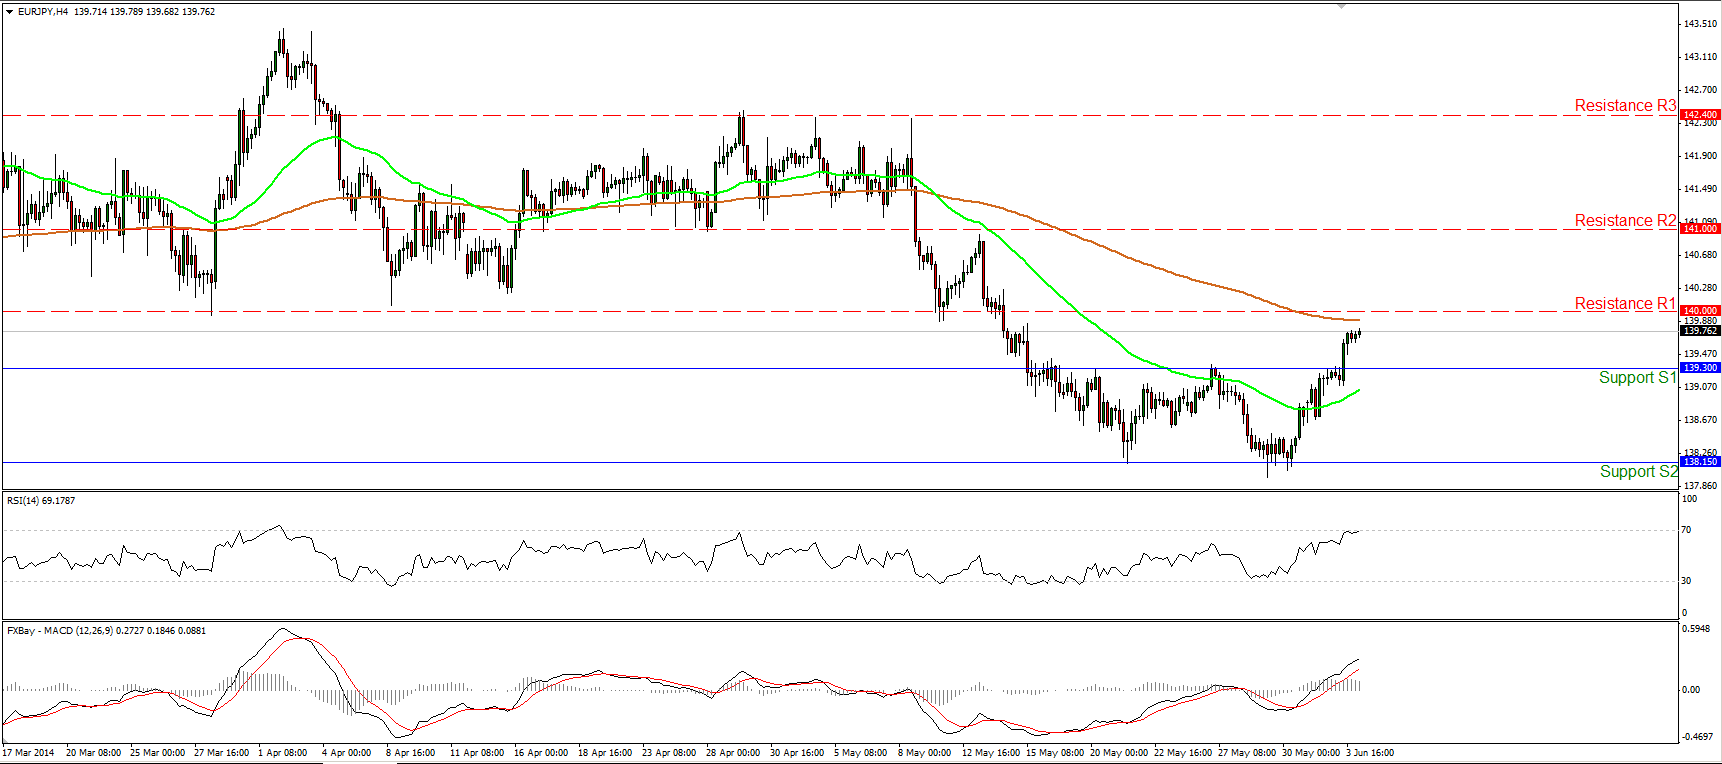
EUR/JPY completes a double bottom
EUR/JPY moved significantly higher, breaking above the 139.30 barrier and completing a short-term double bottom formation. The pair is now heading towards the psychological barrier of 140.00 (R1), slightly above the 200-period moving average. A decisive move above that resistance zone could pave the way towards the next hurdle at 141.00 (R2). The MACD lies above both its trigger and zero lines, confirming the recent bullish momentum, but the RSI is testing its 70 level. As a result, I cannot rule out a pullback after the rate meets the 140.00 (R1) resistance zone.
• Support: 139.30 (S1), 138.15 (S2), 137.55 (S3).
• Resistance: 140.00 (R1), 141.00 (R2), 142.40 (R3).
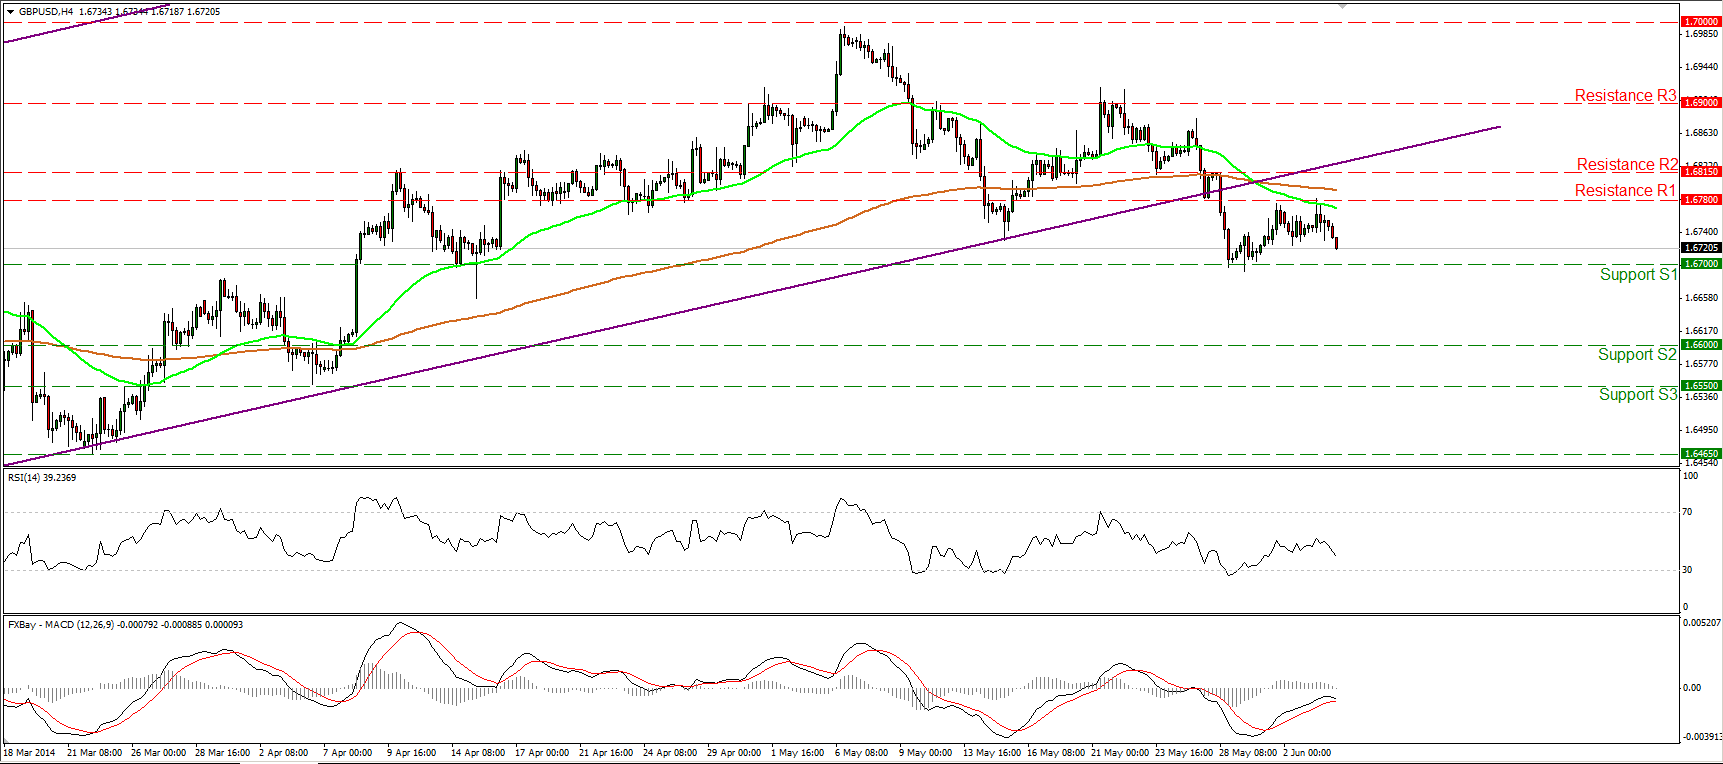
GBP/USD ready to challenge 1.6700
GBP/USD found resistance at the 1.6780 (R1) hurdle and moved lower. The rate remains below the lower boundary of the long-term uptrend channel and below both the moving averages, thus the picture remains negative in my view. If the bears are strong enough to overcome the support of 1.6700 (S1), I would expect them to trigger extensions towards the 1.6600 (S2) zone. The MACD, already in its negative zone, seems ready to cross its trigger line. This would confirm the downside momentum of the price action.
• Support: 1.6700 (S1), 1.6600 (S2), 1.6550 (S3).
• Resistance: 1.6780 (R1), 1.6815 (R2), 1.6900 (R3).
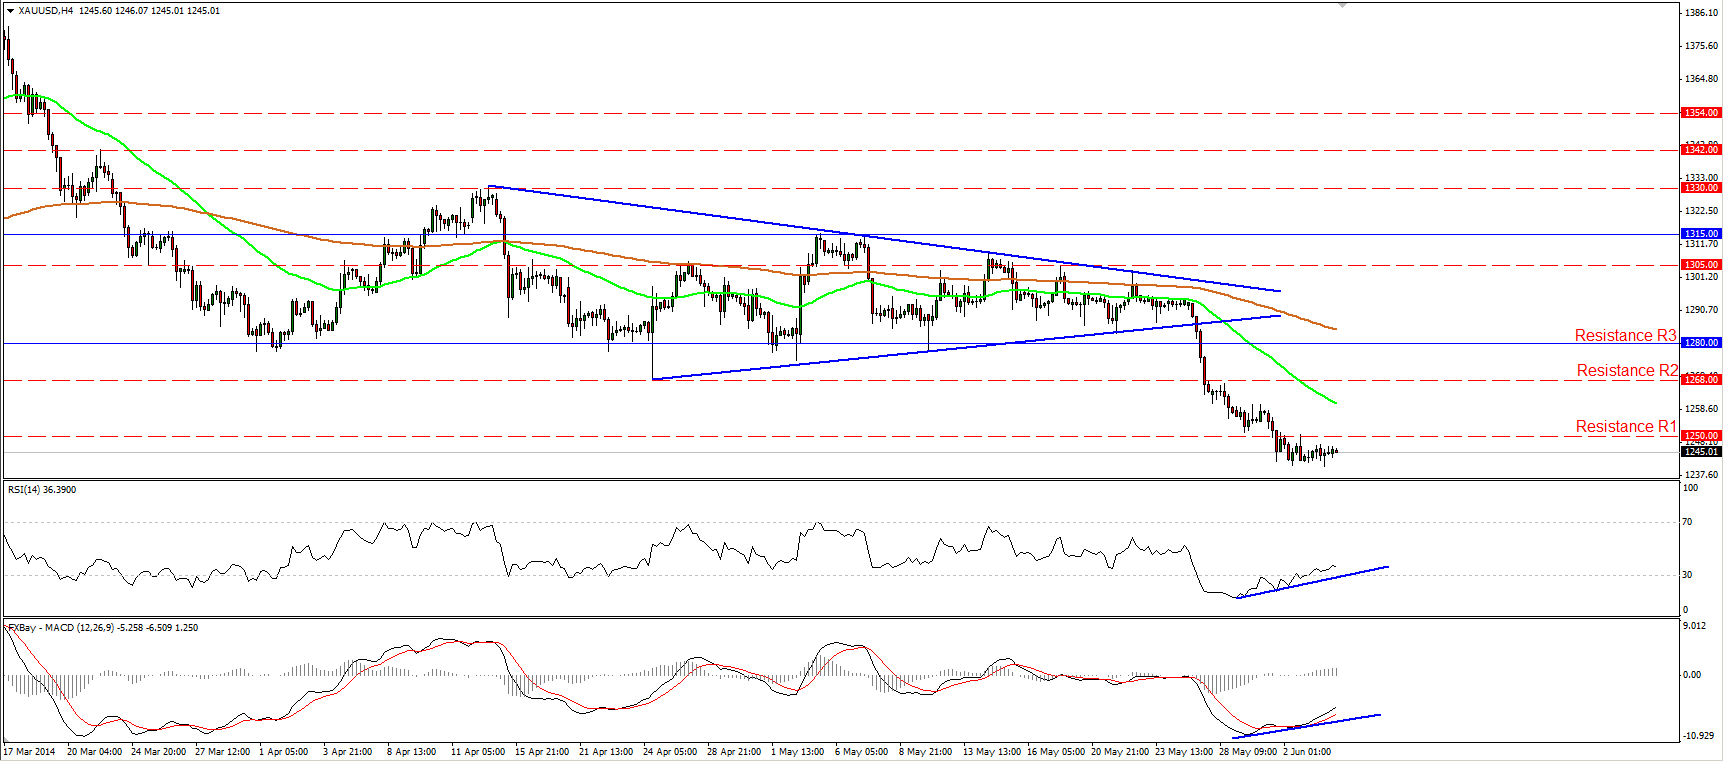
Gold consolidates below 1250
Gold continued moving in a consolidative mode, remaining below the 1250 barrier. I still expect the bears to push the precious metal lower and target the support level of 1235 (S1), slightly above the 161.8% extension level of the triangle’s width. However, the RSI exited overbought conditions, while the MACD, in its negative territory, lies above its trigger line. Moreover, we can identify positive divergence between both our momentum studies and the price action. As a result, I cannot rule out further consolidation or a corrective move above the 1250 (R1) barrier before the bears prevail again.
• Support: 1235 (S1), 1218 (S2), 1200 (S3) .
• Resistance: 1250 (R1), 1268 (R2), 1280 (R3).
WTI meets resistance at the upper bound of the channel
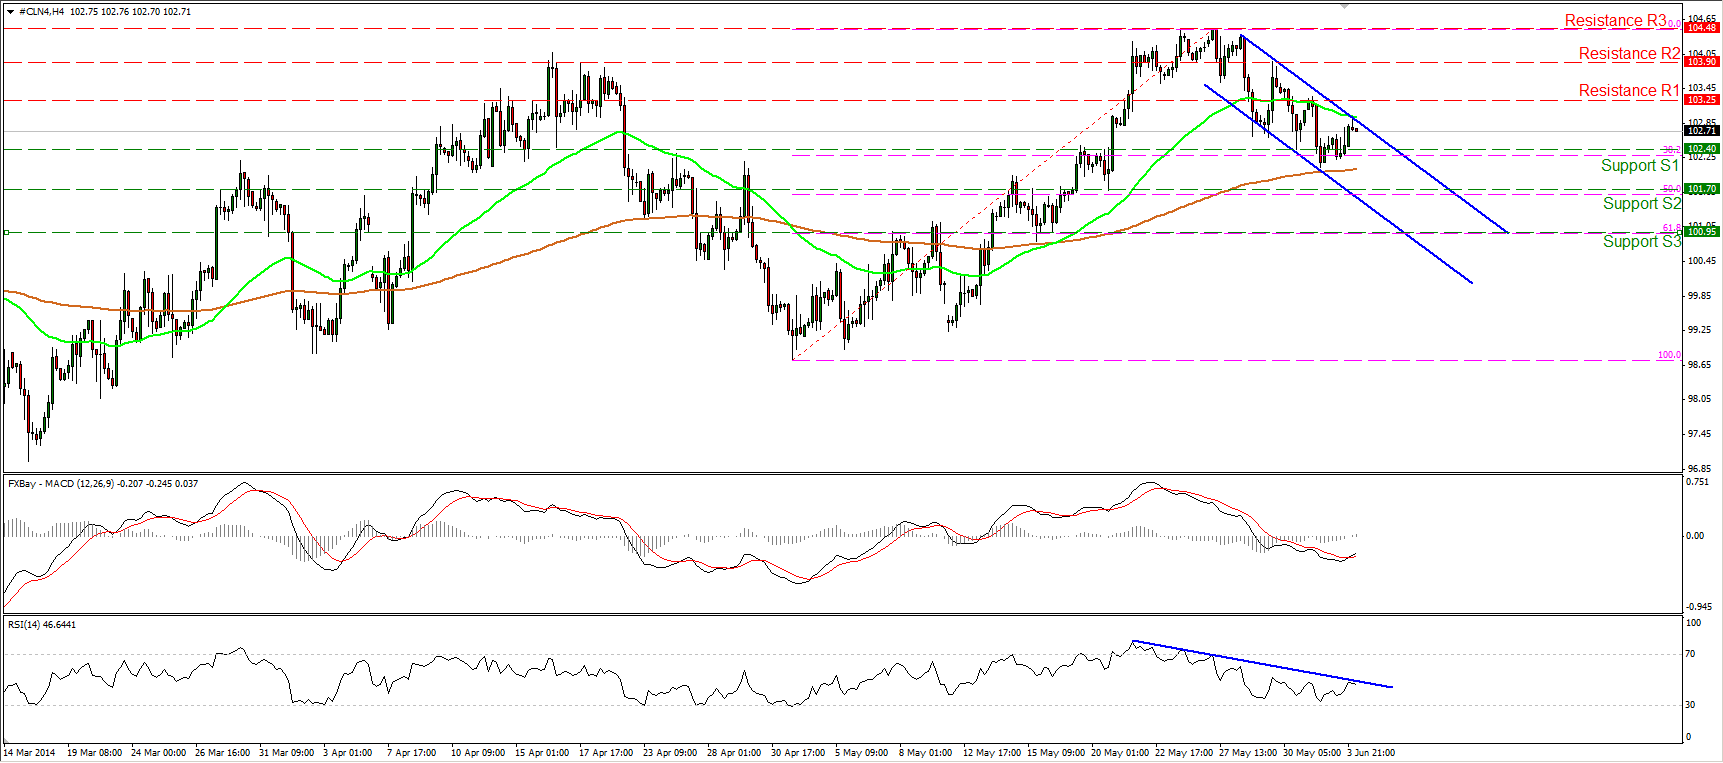
WTI failed once again to overcome the 102.40 (S1) support, near the 38.2% retracement level of the prevailing short-term advance. The price then found resistance at the upper boundary of the blue downward sloping channel. The MACD, although in its bearish territory, crossed above its trigger line, but the RSI hit its blue resistance line and moved slightly lower. Considering the mixed signals provided by our momentum studies and the reluctance of the bears to overcome the 102.40 zone, I would keep a neutral stance for now.
• Support: 102.40 (S1), 101.70 (S2), 100.95 (S3).
• Resistance: 103.25 (R1), 103.90 (R2), 104.48 (R3).

